Carbon Accounting vs. Carbon Footprint: Selection Guide for Low-Carbon Park Scenarios
Carbon emission monitoring is evolving from "Annual Accounting" to "Real-Time Visibility."
Introduction: The Shift in GHG Management
Against the backdrop of global "dual carbon" goals and the expansion of carbon markets, greenhouse gas management is shifting from extensive statistical methods to refined, verifiable, and traceable data governance. In the past, enterprises primarily relied on annual or quarterly carbon accounting, estimating emissions based on energy consumption, raw material usage, and emission factors. Such data, typically aggregated on a monthly or yearly basis, is suitable for compiling inventories and completing compliance reports, but it falls short in promptly detecting process fluctuations, equipment anomalies, or fugitive emissions.
With the maturation of online monitoring, remote sensing observation, and data analysis technologies, carbon emission monitoring has begun to possess multi-level capabilities at the minute, stack, and regional scales. The boundaries among carbon accounting, carbon footprinting, and real-time data are being redefined.
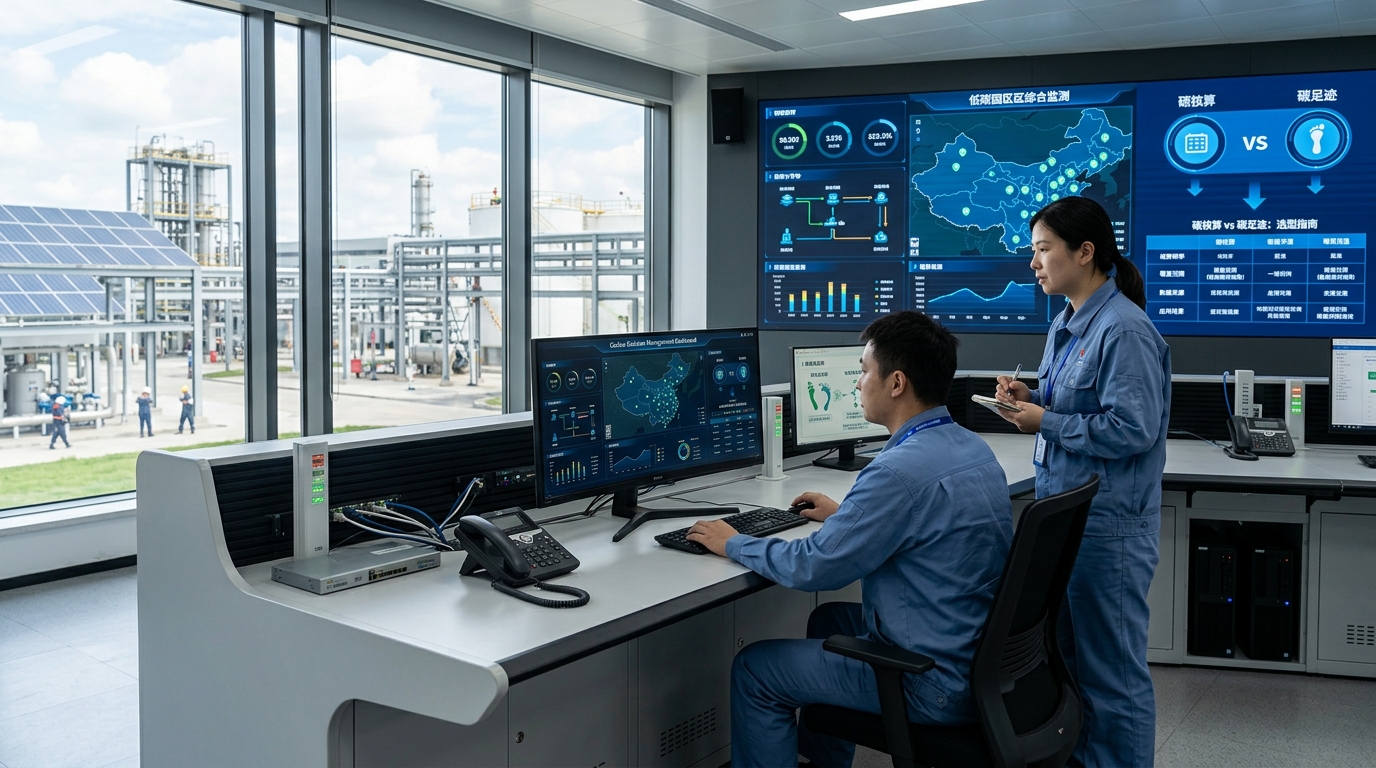
Technical comparison of modern carbon monitoring solutions.
The Four Mainstream Technical Routes
From the perspective of industry observation, current mainstream technical routes can be summarized into four categories. Each varies significantly in temporal resolution, spatial resolution, uncertainty, cost, and target applicability:
- Route 1: Carbon accounting based on emission factors and mass balance.
- Route 2: Point-source online monitoring based on CEMS (Continuous Emission Monitoring Systems).
- Route 3: Regional monitoring based on fenceline concentration, open-path laser, drones, and satellite remote sensing.
- Route 4: Source apportionment based on isotope and component tracing.
If enterprises only pursue low-cost compliance, they may opt for the accounting method; if they need to support carbon market compliance, process optimization, or anomaly tracing, they must introduce online monitoring; if they are targeting industrial parks, cities, or supply chains, they must integrate remote sensing with multi-source data fusion.
Defining Boundaries: Inventories, Evidence, and Closed Loops
1. Carbon Accounting: The Foundation
Carbon accounting typically targets organizational or project boundaries to quantify Scope 1, Scope 2, and partial Scope 3 greenhouse gas emissions. Its basic logic is "activity data multiplied by emission factors." Common international frameworks include the GHG Protocol and ISO 14064. For example, grid emission factors in different regions may range from 0.2 to 0.8 kilograms of CO2 per kWh.
2. Online Monitoring: The Evidence
The value of online monitoring lies not merely in replacing accounting, but in providing continuous evidence and anomaly clues. When evaluating systems, focus on temporal resolution, data capture rate, and measurement uncertainty. For instance, a 660 MW thermal unit deploying CEMS can continuously collect parameters like CO2 concentration and flue gas temperature, with an effective data capture rate generally required to be no less than 95%. This pushes carbon management from "post-event reporting" to "process control."
Deep Dive: Selecting the Right Technology
Technical Route 1: Emission Factor & Mass Balance
Best for: Low-cost foundational accounting, SMEs, Scope 3 estimation.
This is the most widely applied route due to its broad industry coverage and low implementation threshold. However, it suffers from data lag and insensitivity to anomalous emissions. A fuel metering error of just 2-5% can expand the uncertainty of final results to over 10%.
Key Takeaway
Suitable for annual inventories, but requires strict verification of measuring instruments and fuel testing.
Technical Route 2: CEMS & Process Instruments
Best for: High-concentration point sources (Power, Cement, Steel).
CEMS provides continuous, intuitive, and traceable data. It measures CO2 concentration, oxygen, and flow velocity to calculate mass flow rates. While initial investment and O&M costs are high, it enables stack-level accounting and rapid detection of anomalies like air leakage or combustion fluctuations.
Key Takeaway
Essential for carbon market verification and process optimization in heavy industry.
Technical Route 3: Fenceline, Laser & Remote Sensing
Best for: Fugitive emissions, Industrial Parks, Methane leaks.
Stack monitoring is insufficient for fugitive emissions. This route uses methane sensors, open-path lasers, drones, and satellites (e.g., Sentinel-5P, GHGSat) to cover broad spatial areas. It can detect hidden leaks and regional hotspots, though inversion uncertainties (20-50%) remain a challenge.
Key Takeaway
Critical for park supervision and identifying unorganized emissions that traditional meters miss.
Technical Route 4: Isotope & Component Tracing
Best for: Source apportionment, Biomass vs. Fossil fuel distinction.
When you need to know "where the carbon comes from," isotopes like 14C and δ13C provide unique value. Since fossil fuels lack 14C while biomass contains it, this method accurately distinguishes between fossil and renewable carbon sources, reducing reliance on default factors.
Key Takeaway
High cost and low temporal resolution make it best for supplementary verification rather than real-time monitoring.
Selection Advice and Outlook
Enterprises should avoid a "one-size-fits-all" approach. Instead, combine technologies by scenario to build a trusted carbon data system:
- Thermal Power, Cement, Steel: Use emission factor accounting as the foundation, overlay CEMS online monitoring, and retain manual comparison to form a closed loop.
- Chemical, Oil & Gas, Landfills: Focus on filling gaps in methane fugitive monitoring using fixed sensors, open-path lasers, and drone mobile monitoring.
- Waste Incineration & Urban Monitoring: Introduce isotope methods (14C, δ13C) for source apportionment.
- Supply Chain Management: Use life cycle data as the core, combined with procurement and logistics data to enhance Scope 3 traceability.
The Future: Multi-Source Fusion
Looking ahead, carbon emission monitoring will exhibit a trend of multi-source fusion. Carbon accounting provides the foundation, online monitoring provides process evidence, remote sensing provides spatial perspectives, and isotopes provide source identification. Organizations equipped with the capabilities of "accounting as the foundation, online monitoring as the evidence, remote sensing as the observation, and isotopes as the identifier" will gain stronger competitiveness in carbon compliance and market trust.