Development Opportunities for Low-Carbon Industrial Parks in 2026 Under the Dual Carbon Goals

Introduction: Low-Carbon Parks Enter the “System Capability” Competition Stage
Parks are important spatial carriers of China's industrialization and urbanization, serving as highly concentrated units of energy consumption, carbon emissions, and industrial organization. With tens of thousands of industrial parks nationwide supporting a substantial share of industrial output, and industrial energy consumption accounting for approximately 60% of national final energy consumption, parks have become key scenarios for realizing the “dual carbon” goals.
Previously, low-carbon parks were often understood as rooftop photovoltaics, landscape greening, or single-point equipment retrofits. Today, this perception is being redefined. The core of a low-carbon park is no longer just “whether energy-saving actions exist,” but whether it possesses system capabilities covering energy generation, transmission, use, storage, trading, and carbon asset management.
Under the framework of peaking carbon before 2030 and achieving neutrality before 2060, constraints are shifting from “total energy consumption” to “carbon emission intensity,” and from “regulatory compliance” to “green competitiveness.”
Elements such as Energy Management Systems (EMS), energy efficiency optimization, distributed energy resources, and carbon management platforms are moving from concepts to engineered implementation. Over the next three to five years, park competitiveness will increasingly depend on energy consumption per unit of output value, green electricity ratio, energy resilience, and carbon accounting accuracy.
Market Trends: From Energy-Saving Retrofits to Energy Asset Operations
Trend 1: System Optimization
Single-point retrofits (LEDs, VFDs) are giving way to system-wide synergy. Park owners now focus on the interplay between energy costs, carbon costs, power reliability, and green electricity absorption.
Trend 2: Integrated Services
"Generation-grid-load-storage" integration is mainstream. Parks are becoming distributed power sources and flexibility resource providers, shifting service models from EPC to managed energy services.
Trend 3: Efficiency over Capacity
Evaluation shifts from installed PV capacity to system efficiency. Key metrics include levelized cost of electricity, peak-valley arbitrage revenue, and dispatchable capacity.
The competition among low-carbon parks is essentially shifting from equipment competition to system operation competition. Lack of intelligent dispatching often leads to insufficient self-consumption rates and low energy storage utilization, highlighting the need for holistic system design.
Policy Impact: Changing Park Governance Logic
The transition from dual control of energy consumption to dual control of carbon emissions significantly alters policy compliance spaces. If parks optimize their structure through distributed photovoltaics, green electricity trading, or hydrogen energy, their regulatory standing improves. For high-energy-consuming clusters, carbon emission intensity becomes a basis for project admission and financing support.
- Green Standards: Requirements extend from enterprise level to park level via green factory and near-zero-carbon park pilots.
- Cost Structure Changes: Time-of-use tariffs, demand response mechanisms, and ancillary service markets increase electricity bill volatility if not managed by EMS.
- International Pressure: EU CBAM, supply chain carbon footprint disclosure, and ESG ratings transmit carbon pressures directly to export-oriented parks.
Policy impacts are no longer merely about “saving energy,” but about providing verifiable low-carbon evidence. Construction must simultaneously address energy efficiency, data quality, and carbon asset credibility.
Technical Direction 1: EMS Upgrading to the Decision Hub
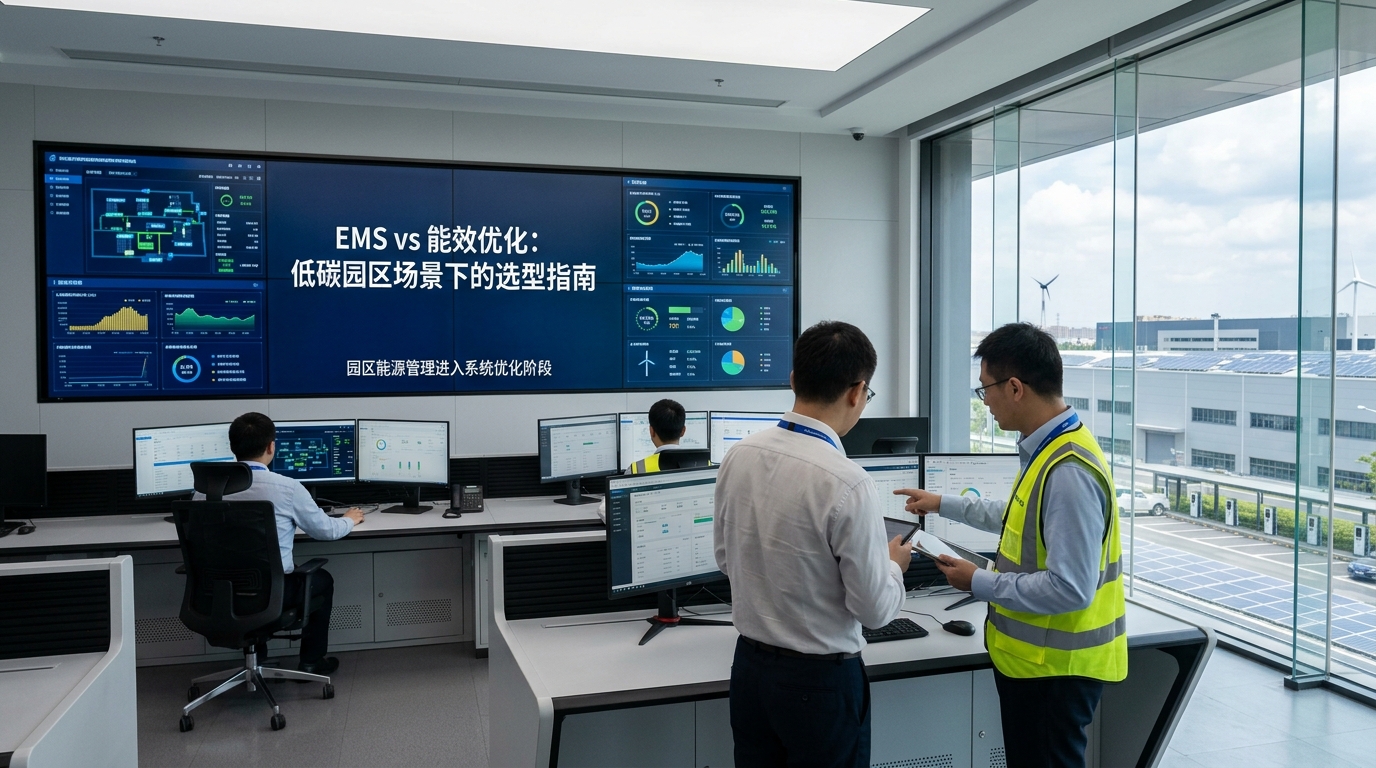
The Energy Management System (EMS) is evolving from a passive monitoring dashboard to an active decision hub. Core tasks include real-time sensing of multi-energy flows, forecasting load/PV output, optimizing storage strategies, and managing maximum demand.
Key Technical Parameters for Mature EMS
- Data Frequency: 15 minutes to 1 minute at key points; second/minute-level for inverters and BMS.
- Device Access Rate: >90-95% for core equipment to enable global dispatch capability.
- Load Forecasting Accuracy: Short-term errors controlled within 3-5% to support reliable strategy execution.
Future evolution involves AI dispatch capabilities (moving from rule engines to reinforcement learning), deep integration with production systems (MES, SCADA, ERP), and electricity-carbon coordination that generates auditable carbon data.
Technical Direction 2: Multi-Energy Complementarity
Energy efficiency optimization targets are expanding from individual devices to the entire system. Common combinations include “rooftop PV + distributed storage + charging piles + waste heat recovery + CCHP + microgrid.”
Industrial Scenarios
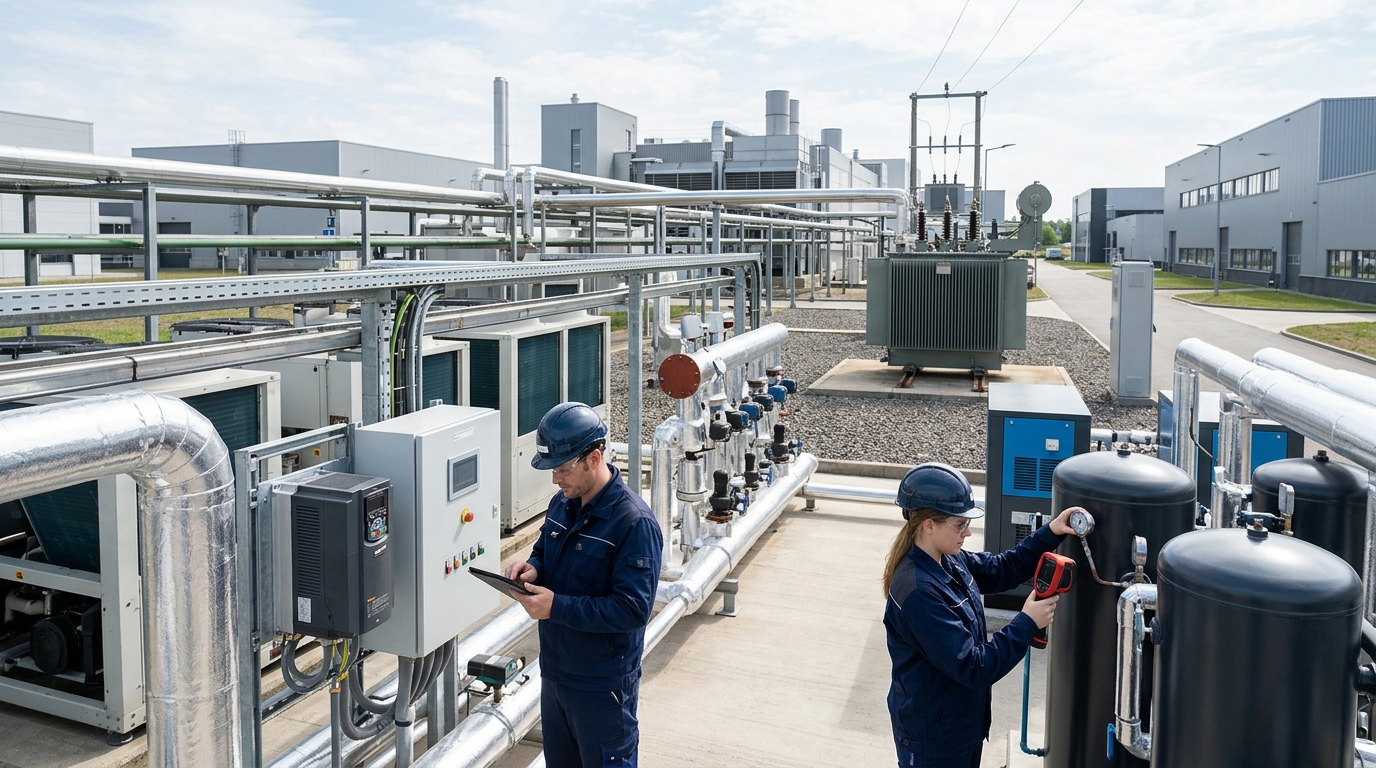
Compressed air, steam, and process waste heat are primary consumers. Retrofitting air compressor systems can achieve 10-30% electricity savings. Steam system optimization can reduce fuel consumption by 5-15%.
Building-Oriented Scenarios
HVAC and lighting are key areas. Smart lighting controls can save 30-60% on lighting energy. Central HVAC group control with AI forecasting can achieve overall energy saving rates of 8-20%.
The goal is balancing energy costs, reliability, carbon intensity, and production constraints, rather than simply reducing electricity consumption.
Energy-Saving Path: Full-Lifecycle Management
A closed-loop path ensures benefits continue to be generated: Metering → Baseline → Diagnosis → Retrofit → Operation → Verification → Carbon Management.
| Step | Action & Benefit |
|---|---|
| Metering & Baseline | Establish sub-metering for electricity, water, gas, heat. Define rational vs. inefficient consumption using historical data. |
| Diagnosis & Retrofit | Identify leaks, overcooling, or idling. Implement high-efficiency motors, VFDs, smart lighting, and storage deployment. |
| Operation & Verification | Use EMS for demand management (5-10% max demand reduction). Verify savings to avoid "quantification gaps." |
| Carbon Management | Convert energy data into reportable, verifiable, and tradable carbon assets. |
In regions with significant peak-valley price spreads (0.6-1.0 yuan/kWh), commercial storage projects may see payback periods of 4-7 years, depending on load curves and battery life.
Case Observations: Quantified Benefits
Electronics Manufacturing Park
Scale: 350,000 sqm | Assets: 8MW PV, 1.5MWh Storage, 1800 Metering Points
Achieved 12% overall energy saving rate and annual CO2 reduction of ~2,400 tons. Payback period: 5-6 years. Success driven by combining green electricity, storage, and HVAC group control optimization.
Chemical Energy Park
Focus: Steam, CHP, Process Waste Heat | Assets: 12MW PV, 2MWh Storage
Comprehensive energy consumption decreased by 8%; carbon intensity per output value dropped by 11%. Challenges included coordinating EMS with DCS/SCADA for process safety and continuous production.
Logistics Transportation Park
Focus: Charging, Warehouse HVAC | Assets: 6MW PV, 1MWh Storage, 200 Piles
Green electricity ratio reached 35%; comprehensive energy costs decreased by 9%. Demonstrated how transportation loads can become flexibility resources via orderly charging and virtual power plant aggregation.
Forward-Looking Outlook: Five Directions for 2030
- Standardized Near-Zero Carbon Parks: Shift from demonstration models to standard configurations. New parks will integrate energy systems and carbon platforms at the planning stage.
- Electricity-Carbon Coordination: EMS and carbon platforms will jointly serve procurement and scheduling. Questions shift to “how much carbon corresponds to each kWh” and “is green electricity traceable?”
- Virtual Power Plants (VPP): Aggregation of storage, HVAC, and EV loads to participate in demand response and spot markets. Revenue expands from saving bills to providing flexibility services.
- Deep AI Integration: Digital twins will simulate scenarios for optimal strategy selection. Leading parks may control forecasting errors within 3% and achieve minute-level dispatch cycles.
- Carbon Assets & Green Finance: Transparent data on savings and emissions will interface with green credit, REITs, and ESG ratings. Evaluations will include financial, carbon, risk, and brand returns.
By 2030, advanced low-carbon parks may exhibit green electricity ratios of 30-70%, storage capacity accounting for 5-20% of max load, and EMS coverage above 80%. While challenges like data standards and cybersecurity remain, those who integrate EMS, efficiency optimization, and dual carbon management will lead the next stage of industrial competition.