From Technical Challenges to Successful Implementation: An Account of the Urban Pipeline Network Project
Against the backdrop of frequent extreme rainfall, urban drainage systems are shifting from "experience-based dispatch" to "data-driven dispatch." This project demonstrates how multi-source monitoring data serves as the fundamental support for urban flood prevention.
Introduction: Drainage Network Monitoring Becomes the "Front-End Sensor"
As a concealed underground infrastructure, the operational status of the drainage network has long been difficult to monitor in real time. A rapid rise in water level, abnormal flow changes, or localized backwater in pipe sections often indicate the formation of surface waterlogging risks. Therefore, multi-source monitoring data such as water level, flow rate, and rainfall are becoming the fundamental support for urban flood prevention efforts.
This article takes the drainage network monitoring and flood prevention early warning project in the central urban area of a city in East China as an example. The project covers approximately 48.6 square kilometers of the old urban area, serving a population of about 680,000. Through continuous monitoring of key indicators such as water level and flow rate, the project formed a relatively stable early warning and response closed-loop during the 2024 flood season.
Project Background: The Drainage System in the Old Urban Area Faces Multiple Pressures
The central urban area features low-lying terrain and a dense river network, significantly affected by the backwater effect of the outer river water level during the flood season. The local multi-year average annual rainfall is about 1,320 mm, with short-duration heavy rainfall occurring frequently. Under heavy rainfall conditions, mismatches often occur among the drainage capacity of the stormwater network, the pumping capacity of pump stations, and the receiving capacity of the rivers.
Infrastructure Scale
- 312 km of drainage pipelines
- 8,600 manholes
- 9 stormwater pump stations
- 12 underpasses
Historical Pain Points
- Average detection time: 45 minutes
- Average response time: 120 minutes
- Deepest recorded waterlogging: 0.42 meters
- Traffic interruption: >90 mins
Previously, drainage management relied mainly on manual patrols and hotline feedback. Due to the lack of real-time data on network water levels and flow rates, dispatchers found it difficult to determine whether waterlogging was caused by excessive rainfall intensity, network blockage, external water backwater, or delayed pump station operation. Based on this, the local drainage authority launched the "Central Urban Area Drainage Network Operation Monitoring and Flood Prevention Early Warning Project," hoping to shift the flood prevention focus forward through online monitoring and model analysis.
Technical Challenges: The Triple Challenge
Implementing this system faced three distinct hurdles:
1. Complex Underground Environment
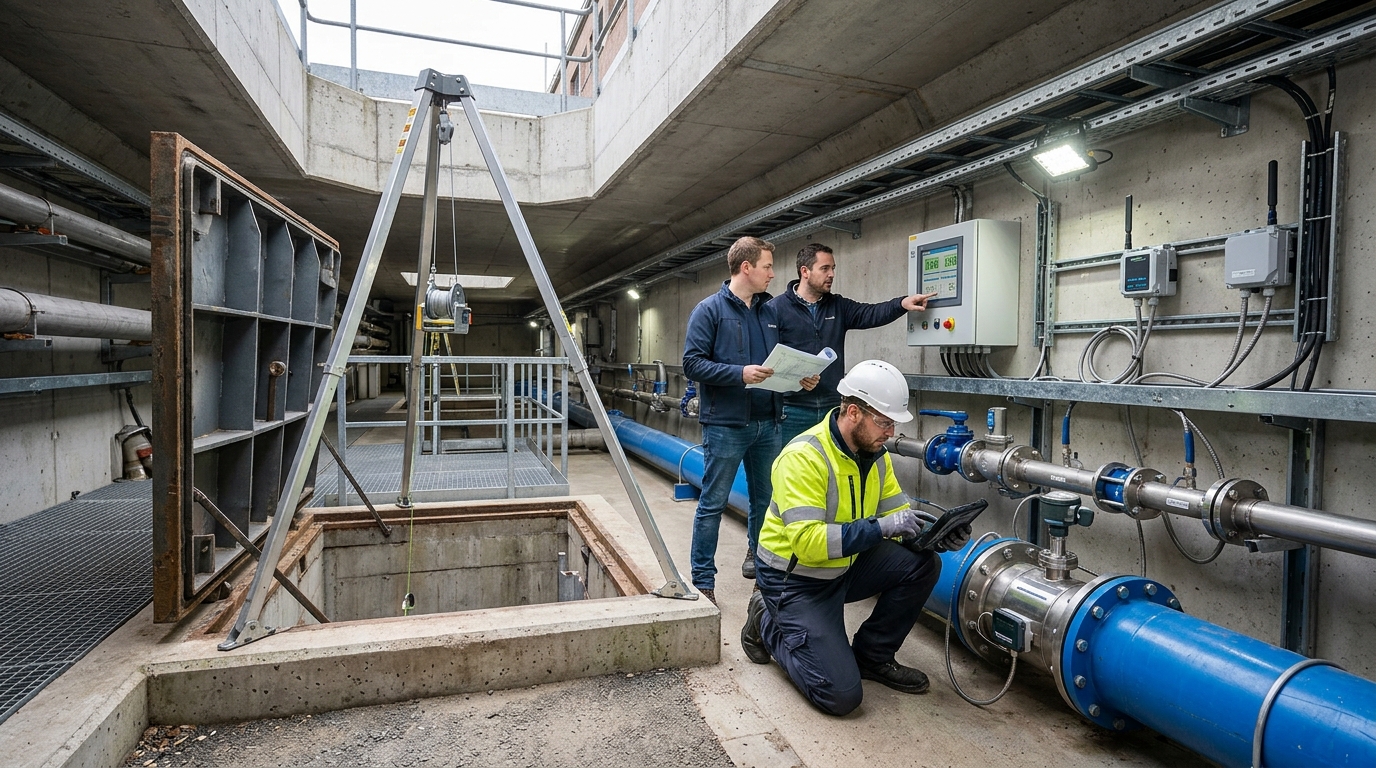
Manholes are damp, corrosive, and contain hazardous gases (hydrogen sulfide, methane). Wireless signal attenuation is significant beneath roads, making traditional wired methods costly and wireless transmission technically demanding regarding power consumption and antenna placement.
2. Data Interference & Quality
Drainage pipelines are not ideal open channels. Water levels are affected by downstream backwater, pump operations, and siltation. Flow rates vary with pipe diameter and velocity distribution. Relying solely on single-threshold alarms leads to false alarms (e.g., high sewage levels due to siltation vs. infiltration).
3. Model Alignment with Business Processes
Urban flood prevention is a combined result of rainfall, runoff, conveyance, pumping, and topography. Models must be "interpretable, executable, and verifiable" for grassroots personnel, translating complex data into specific actions like patrols and traffic control.
Solution: Integrated Monitoring System Architecture
The project is built on a four-tier architecture of "perception, transmission, platform, and application."
Perception Layer Deployment
- Water Level: 186 points (152 radar transmitters, 34 pressure transmitters). Range: 0-6m, Accuracy: ±3mm.
- Flow Rate: 68 points (Doppler flow meters). Covers DN300-DN2000 pipes. Velocity range: 0.03-5 m/s.
- Rainfall & Video: 46 automatic rain gauges, electronic staff gauges at 12 underpasses, and smart manhole covers.
Key Technical Specifications
- Ingress Protection: IP68 for underwater durability.
- Power Management: Routine reporting every 5 minutes; switches to encrypted 1-minute intervals when thresholds are exceeded.
- Connectivity: NB-IoT and 4G Cat.1 with external antennas for weak signal areas; fiber optics at key nodes.
Platform & Algorithm Logic
The platform integrates GIS-based network topology with a simplified hydraulic model. It calculates three critical indicators:
- Pipe Fullness Degree: Determines proximity to full-pipe flow.
- Key Section Flow Capacity: Identifies bottleneck pipe sections.
- Waterlogging Risk Index: Predicts timing and depth of potential flooding.
Hierarchical Warning Rules:
• Operation Prompt: Manhole water level reaches 80% of pipe crown.
• Level 2 Warning: Water level 0.3m below ground + rising >0.05m/15min.
• Level 3 Alarm: Water level near ground + Rainfall >30mm/h + Underpass gauge >0.10m.
Implementation Process: From Survey to Calibration
Launched in March 2023, the project followed a rigorous implementation path:
Data Governance
Verified 312km of pipelines, numbered 8,600 manholes, and conducted CCTV inspections on 86km of key sections, identifying 214 defects.
Installation
May-August 2023. Night construction to minimize traffic impact. Strict confined space protocols. Prioritized upstream/downstream of waterlogging zones.
Calibration
Used 12 historical rain events (2022-2023) to calibrate runoff coefficients and roughness. Achieved <5mm deviation in water levels and <6% error in flow rates.
In May 2024, a joint drill involving drainage, emergency management, urban management, and traffic police departments successfully simulated underpass waterlogging and pump station failure scenarios under intense rainfall (70 mm/h).
Operational Results: Earlier Warnings, Faster Response
During the 2024 flood season, the system handled 17 heavy rainfall events effectively.
Performance Metrics
- Effective Warning Ratio 96.8%
- False Alarm Rate 3.2%
- Total Prompts Generated 1,842
- Level 3 Alarms 58
Response Time Improvement
Case Study: June 24 Heavy Rainfall Event
On June 24, with maximum hourly intensity reaching 86.5 mm, the system detected a rapid water level rise at a key underpass upstream pipe (0.62m to 0.94m) at 16:12. A Level 2 warning was issued at 16:14, upgrading to Level 3 at 16:21.
The drainage dispatch center immediately activated 3 pump station units and dispatched 2 mobile pump trucks. By 16:48, waterlogging reached 0.27 meters but did not exceed the 0.30-meter control value. Traffic was never interrupted, demonstrating the effectiveness of the "predict-and-preempt" strategy.
Outlook: Moving from Point Monitoring to Systematic Management
This case demonstrates that drainage network monitoring requires completing point layout, data governance, model calibration, and dispatch process reengineering around business objectives. Only when water level changes, flow rate anomalies, rainfall intensity, pump station operations, and on-site response form a closed loop can monitoring data truly be transformed into urban safe operation capabilities.
Looking ahead, local authorities plan to expand the monitoring scope from 2025 to 2027, adding ~120 water level points and ~30 flow rate points. The system will incorporate sponge city facilities, detention basins, and newly built pump stations. Furthermore, integration with emergency management, traffic management, and meteorological radar data will promote the transformation of drainage and flood prevention from "post-event response" to full-process management of "pre-event prediction, in-event dispatch, and post-event evaluation."

