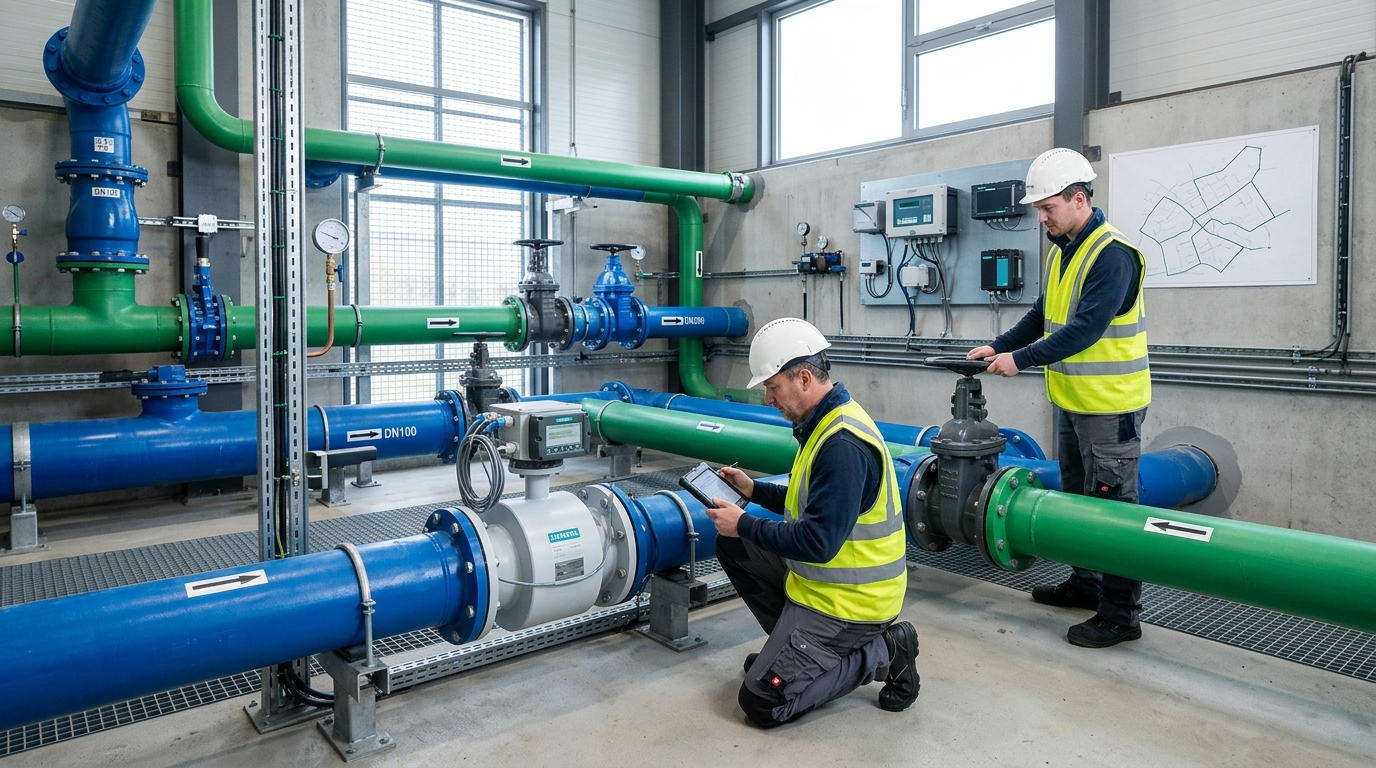
Urban Pipeline Network Project Practice: Drainage Pipeline Monitoring Application Case
In recent years, with the increasing frequency of extreme rainfall events, urban drainage systems have faced continuously rising pressure. Traditional drainage management has relied more on manual patrols, post-event disposal, and experience-based judgment, making it difficult to accurately grasp changes in pipe network water levels, flow rates, and flood-prone spots before rainfall arrives.

A drainage pipe network monitoring project in the old urban area of a certain city was implemented against this background. The project focuses on key indicators including drainage, water level, flow rate, and flood prevention, and deploys monitoring devices on trunk pipes, branch pipes, pump station forebays, underpasses, and low-lying road sections, forming a sensing network covering a catchment area of approximately 136 square kilometers. Through continuous operation and validation across multiple rainfall events, the project has preliminarily achieved the transition from “post-flooding disposal” to “pre-rainfall early warning, in-rainfall dispatching, and post-rainfall assessment.”
Project Background: The Contradiction between Drainage Capacity in Old Urban Areas and Extreme Rainfall
The project area is a typical old urban area, with a built-up area of approximately 136 square kilometers and a permanent population of about 820,000. The drainage pipe network in this area was built over a long period. Early pipelines were mainly combined sewers and direct stormwater discharge; since 2000, stormwater-sewage separation retrofitting has been gradually carried out. However, constrained by road space, underground utilities, building foundations, and the existing drainage system, some areas still have residual combined sewer systems, undersized pipes, and poor outlet conditions.
Infrastructure Overview
- ~218 km drainage trunk pipes
- ~146 km stormwater pipes/channels
- ~42 km² combined sewer areas
- 15 drainage pump stations
- 27 flood-prone spots
Capacity Challenges
Most stormwater pipes were designed for a 3-to-5-year return period, while some early sections have actual capacity <2-year return period. Underpasses are prone to waterlogging under short-duration heavy rainfall.
"Before the project was launched, local waterlogging incidents occurred multiple times. During a heavy rainfall event in 2023, the maximum hourly rainfall reached 62 mm. The waterlogging depth in an underpass exceeded 45 cm, interrupting traffic for about 3 hours."
Post-event analysis found that there was a lack of real-time data on internal water level changes. Pump station dispatching mainly relied on on-site duty personnel and manual judgment. Based on this, the project construction objectives were clearly defined as establishing a drainage pipe network monitoring network for water level, flow rate, rainfall, and waterlogging; forming flood prevention early warning and dispatch support capabilities; and improving the operation and management efficiency of the drainage system.
Technical Challenges: Multi-Source Data Governance
Drainage pipe network monitoring is not simply the installation of a few level gauges or flow meters. Its core difficulty lies in the complex operating state of the pipe network, strong data correlation, and harsh field environments.
No stable one-to-one correspondence between water level and flow rate. The same pipe section under different slopes, siltation degrees, and downstream backwater conditions may correspond to different flow rates at the same water level. Judging drainage capacity based on a single water level threshold is prone to false alarms.
Aging pipe networks suffer from siltation and damage. Preliminary inspection found that about 18% of monitored pipe sections had varying degrees of siltation. Siltation changes the effective flow cross-section, causing monitored water levels to be higher than actual, and affects sensor stability.
Communication and power supply constraints. Many points are located along roads, riverbanks, and underpasses. Signal attenuation is significant in deep wells. The final scheme adopted a hybrid communication method of “4G + NB-IoT + field gateway” to ensure continuous data upload during storms.
Flood prevention warning thresholds require localized calibration. If a uniform alarm value is set, areas with lower design standards may generate frequent alarms, while high-risk areas may be under-alarmed. Threshold ranges were established for 27 flood-prone spots, 15 pump stations, and 86 key pipe sections.
Solution: A Sensing, Analysis, and Dispatch System
The overall project scheme is divided into three parts: sensing layer, data layer, and application layer.
Sensing Layer Deployment
- Water Level: 126 points (Radar & Submersible gauges)
- Flow Rate: 38 ultrasonic Doppler/radar open-channel meters
- Rainfall: 24 stations arranged by catchment subzone
- Waterlogging: 92 points at flood-prone spots
- Video: 12 monitoring points for auxiliary confirmation
- Pump Stations: 15 forebay monitoring points
- Storage Facilities: 3 monitoring points
Note: Radar level gauges prioritize trunk pipes/open channels (±3mm accuracy); submersible gauges used in closed/narrow wells (±1cm accuracy).
Data Layer Strategy: The system uploads data every 5 minutes normally, switching to 1-minute sampling during rainfall or orange-and-above warnings. To reduce false alarms, a sliding time window and trend judgment algorithm is introduced. For example, a higher-level warning is triggered only when water level continuously rises by more than 8% of the pipe diameter within 10 minutes AND upstream rainfall intensity exceeds 10 mm/h.
Application Layer Functions:
- Operational Situational Awareness: Displays pipe network status, identifying high water levels, flow velocities, and abnormal overflows.
- Flood Prevention Early Warning & Dispatch Assistance: Generates pump/gate dispatch suggestions based on forecasts, real-time data, and capacity.
- Post-Event Review: Quantifies warning time, response time, and drainage effectiveness for each rainfall event.
Implementation Process: From Survey to Commissioning
The project launched field surveys in March 2024. After review, the initial design of 158 points was adjusted to a total scale of about 300 devices (126 water level, 92 waterlogging, 38 flow). Equipment installation was concentrated from May to July 2024, often conducted at night with segmented traffic diversion to minimize impact. Approximately 420 confined-space well entries were completed with no safety incidents.
Commissioning Approach
- Single-point testing: Verified sensor position, range, zero point, and communication.
- Zone joint commissioning: Grouped by catchment/pump service area to verify platform linkage.
- Rainfall validation: Tracked water level rise speed and dispatch response during July/August 2024 events.
During the trial operation (July 2024 – January 2025), the system collected over 1.32 million water level data points and issued 368 warnings. After multiple rounds of threshold adjustment, the effective alarm rate increased from 64% to 78%, and the false alarm rate decreased from 36% to 22%.
Operational Data and Results
On July 18, 2024, a heavy rainfall event occurred (max hourly rainfall 68 mm). Within 30 minutes, the system detected rapid water level rise in the upstream catchment. A radar gauge showed water level rising from 42% to 78% of pipe diameter. The platform issued an orange warning about 18 minutes before waterlogging occurred.
22 cm
Max Waterlogging Depth
(vs 45cm in 2023)
8 min
On-site Response Time
(vs 37min avg previously)
19%
Reduction in
Drainage Time
Another effect is that pump station dispatching shifted from “experience-based” to “data-based.” In August 2024, the system judged a pump station's rising forebay level as downstream outlet backwater (since downstream flow didn't increase) and recommended stopping some pumps. This reduced ineffective operation by ~2.5 hours and saved electricity consumption by ~18%.
In flood prevention management, all 12 key risk spots achieved linked monitoring of water level, waterlogging, and video. As of January 2025, the project had cumulatively identified 17 severely silted pipe sections and 9 pipe sections with abnormal water levels, incorporating them into maintenance plans.
Investment & O&M Summary
- Total Investment: ~CNY 18.6 million (Equipment: 11.2M, Software: 3.8M, Construction: 3.6M)
- Annual O&M Costs: ~CNY 1.2 million (Data charges, battery replacement, calibration, patrol)
- Value Proposition: Lower investment than large-scale civil works retrofitting, significantly improves operational transparency.
Case Review: Experience and Limitations
While successful, the project exposed common limitations in engineering implementation:
- Equipment Accuracy vs. Data Reliability: Radar gauges can be affected by well walls/edges in narrow spaces. Ultrasonic meters struggle with high sediment/floating objects. Regular patrol, dredging, and calibration mechanisms are essential.
- Threshold Optimization is Continuous: Initial rules relying solely on pipe diameter ratio caused issues. Differentiated thresholds using “water level + flow + rainfall + waterlogging depth” improved effective alarm rates but required ongoing tuning.
- Complex Construction Conditions: Field factors like utility conflicts and traffic permits caused delays and relocations. Fine-grained field surveys regarding well space, slope, and communication coverage are critical to avoid idealized designs.
Outlook: From Monitoring to Resilient Drainage Management
The core value of drainage pipe network monitoring is organizing data into an operable management closed loop. Future governance may deepen along three directions:
1. Densification and Standardization
Expand monitoring to branch pipes, community low-lying spots, and stormwater inlets. Unify device interfaces and data formats to prevent silos.
2. Model and Dispatch Upgrades
Connect monitoring data to hydraulic models for load prediction and optimal pump/gate simulation. Shift from fixed rules to dynamic thresholds based on historical feedback.
3. Coordination with Engineering Retrofit
Use long-term data to identify severely silted or damaged sections, optimizing dredging plans and retrofit priorities. Convert monitoring data into concrete engineering decision bases.
Overall, this project demonstrates that multi-source monitoring can significantly improve flood prevention capabilities without immediate large-scale civil works. It provides a practical sample for transforming urban drainage systems from passive emergency response to proactive, resilient governance.