How a Water Utility Achieved Cost Reduction and Efficiency Through Urban Waterlogging Early Warning
During the 2024 flood season, the central urban area of a sub-provincial city on the east coast of China experienced six rounds of heavy rainfall and the peripheral impacts of two typhoons. Despite maximum hourly rainfall intensity reaching 86.4 mm, the area did not experience prolonged traffic paralysis or incidents of people being trapped. Behind this change is a comprehensive prevention and control project for urban waterlogging warning, completed before the flood season.
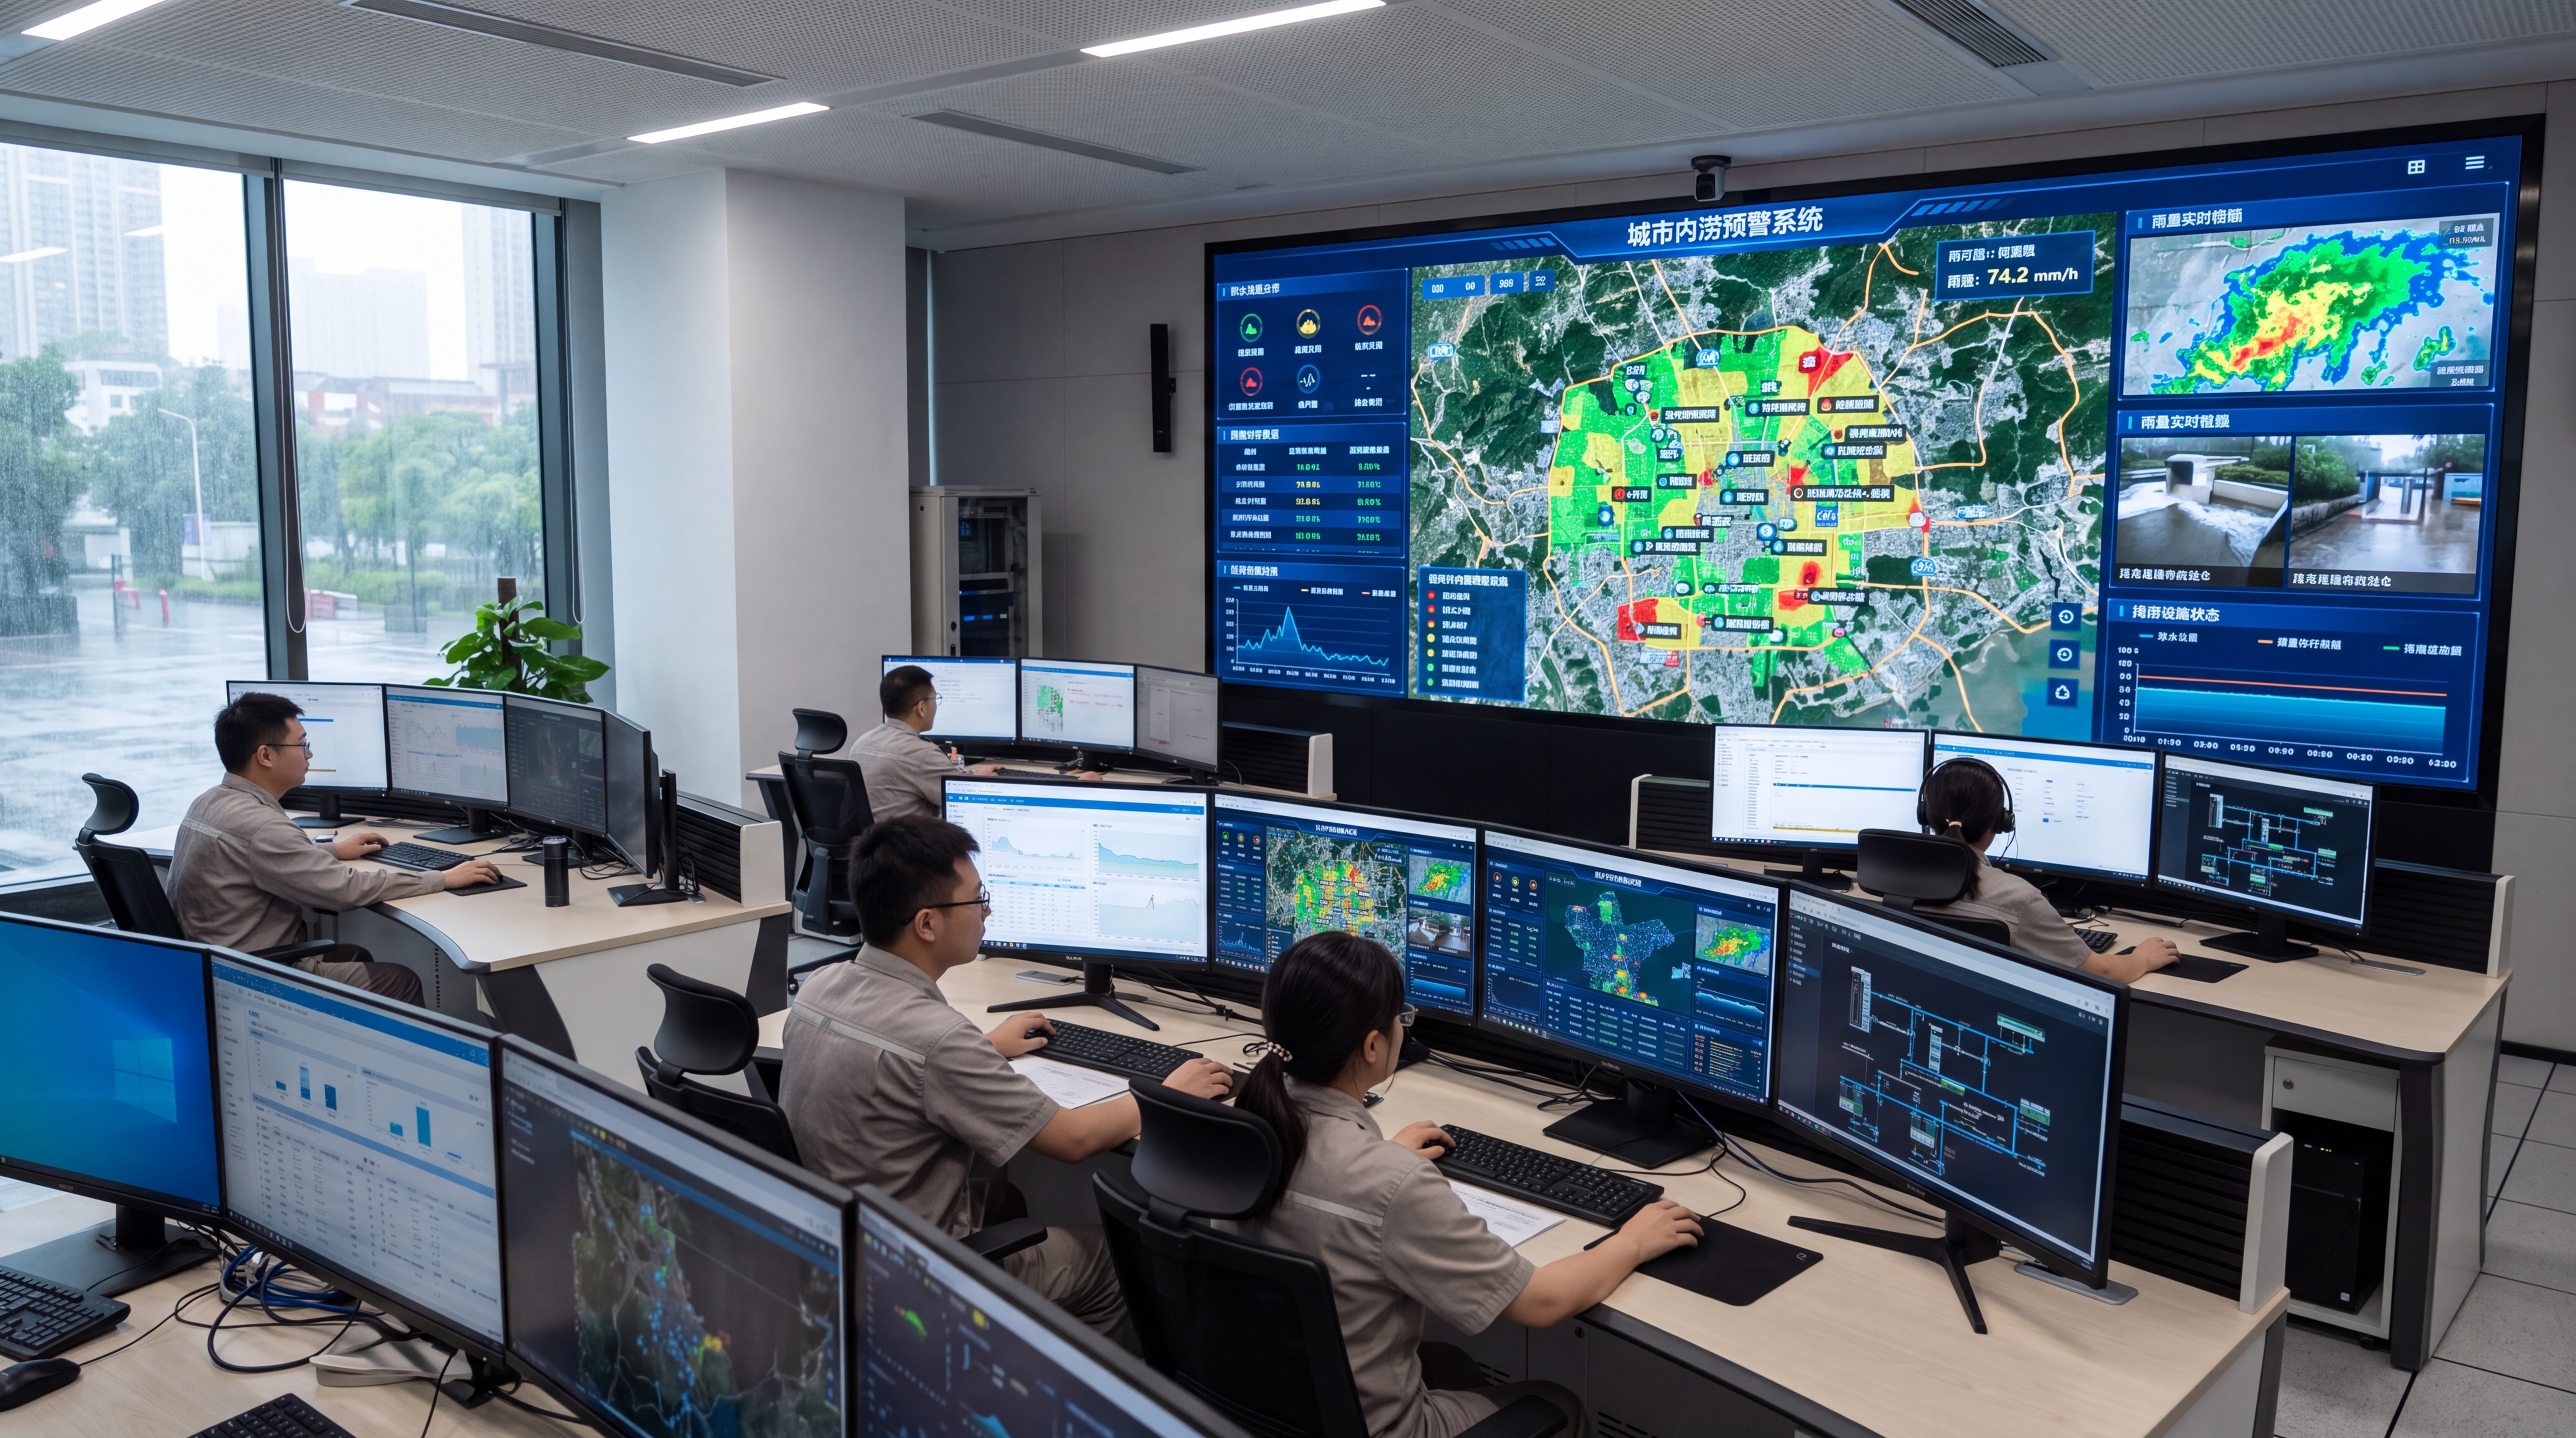
The project covers approximately 86.5 square kilometers, serving a permanent population of about 920,000. Key protection targets include 31 underpasses, 18 subway station entrances, 46 underground garage entrances, and 52 historically flood-prone locations. By integrating radar-based rainfall monitoring with ponding monitoring, pipe network models, and pump station data, the system forms an urban flood control loop of "rainfall forecast—ponding prediction—risk warning—closed-loop response." Operational data shows that after the system went online, the average lead time for ponding risk warnings reached 26 minutes, a significant improvement over previous manual patrol methods.
Yicai Technology participated in the construction of radar rainfall sensing, ponding identification algorithms, warning models, and the flood control command platform, focusing on building a quantifiable, reviewable, and dispatchable engineered system.
Project Background: Long-term Pressure from Ponding Risks
The central urban area features dense networks of roads, underpasses, subways, and underground commercial spaces. Preliminary surveys indicated a total stormwater pipe network length of about 1,286 km, with approximately 38,000 inlets and 22 pump stations. While the main drainage system meets the 20-year recurrence interval standard, some local branch pipes remain at the design capacity of a 1- to 3-year recurrence interval.
- Historical Data: From 2019 to 2023, the area recorded 27 heavy rainfall events, resulting in 146 significant ponding events.
- Response Lag: The average response time was about 84 minutes. For some underpasses, the interval from ponding onset to road closure was only 10–15 minutes.
- Case Study: In a 2022 localized rainstorm, ponding depth at an underpass exceeded 0.35 meters within 17 minutes, causing traffic disruption and requiring nearly 3 hours for pumping and drainage.
To address these issues, local departments established joint construction requirements: improving rainfall monitoring accuracy to a 250-meter grid, increasing warning lead time to ~30 minutes, achieving linkage with pump station dispatch, and conducting data reviews for subsequent remediation.
Technical Challenges: Overcoming Four Hurdles
1. Insufficient Rainfall Monitoring Accuracy
Traditional weather stations (5–8 km spacing) fail to capture localized convective cells. Building obstruction and heat island effects cause significant spatial variations, leading to delayed or misjudged warnings during summer afternoons.
2. Complex Underlying Surface Data
With a building density of 41% and imperviousness rate of 68%, accurate modeling is difficult. About 7.4% of 26,000 manholes required rechecking due to missing data or coordinate deviations exceeding 1 meter.
3. Interference with Ponding Sensors
Underpasses face vehicle obstruction, debris, and poor lighting. Video recognition alone causes false alarms, while level gauges are affected by silt and reflections. Balancing real-time performance, accuracy, and stability is critical.
4. Integration into Business Processes
Warnings must answer "where, how deep, when, who handles it." Without a closed loop involving sub-districts, traffic police, and drainage companies, the system's value is limited. Core metrics were set to "warning accuracy, lead time, and closed-loop response."
Solution: Synergy of Radar, Sensing, and Models
The project adopts a "space-air-ground integrated sensing + model-driven + flood control closed-loop" architecture. The sensing layer centers on an X-band dual-polarization weather radar, supplemented by 312 ground rain gauges, 186 ponding monitoring points, and 1,240 manhole level monitors.
1. Precision Rainfall Estimation
The system uses a joint calibration method combining radar quantitative precipitation estimation with ground rain gauges. By introducing 3D building height data for obstruction correction and optimizing Z-R relationships, the mean absolute error of radar rainfall estimation was controlled within 8.6%, significantly improving the capture of localized rainstorm centers compared to interpolation methods.
2. Coupled Hydrodynamic Modeling
A coupled 1D pipe network and 2D surface hydrodynamic model covers 56.6 square kilometers with a 5m x 5m surface grid. Inputs include real-time radar rainfall, nowcasting, and pump station status. The system performs rolling calculations every 10 minutes to predict ponding occurrence, depth, and affected areas within the next 2 hours.
3. Four-Level Risk Warning Mechanism
- Blue: Predicted depth 0.10–0.19m; patrol attention.
- Yellow: Predicted depth 0.20–0.29m; drainage units on-site.
- Orange: Predicted depth 0.30–0.44m; traffic diversion and temporary closure.
- Red: Predicted depth ≥0.45m; joint emergency response.
Implementation Process: From Data Governance to Commissioning
Launched in April 2023, the project followed three key phases:
- Risk Census & Data Governance: Reviewed 27 historical rainfall events to identify 52 high-frequency ponding points. Conducted on-site rechecking of ~1,900 manholes and corrected ~24,000 records of pipe diameter and invert elevation.
- Sensing System Construction: Completed radar installation and integration of sensors. Adopted a triple mechanism for ponding monitoring: "radar level gauge + video AI + manual verification," using over 2,000 historical images to train the AI module.
- Calibration & Joint Commissioning: Improved the Nash-Sutcliffe efficiency coefficient from 0.62 to 0.86. Conducted 4 joint drills simulating 80 mm/h rainfall scenarios, testing warning release and personnel deployment across 12 sub-districts.
Operational Results: Synchronized Improvement
During the Meiyu season (June 10 – July 20, 2024), the system generated 312 ponding risk warnings with a validity rate of 93.3%. The average warning lead time was 26 minutes, with a maximum of 48 minutes.
Key Performance Indicators
- ✓ Closed-loop Response Time: Reduced from 23 minutes to 6 minutes for risk confirmation.
- ✓ Underpass Incident (July 15): Traffic police arrived 12 minutes before ponding formed. Traffic restored in 38 minutes, reducing response time by ~60% compared to historical averages.
- ✓ Typhoon Impact Mitigation: Proactive pre-discharge of 210,000 m³ from rivers and 160,000 m³ from pump stations prevented significant property loss from underground garage flooding.
- ✓ Economic Benefit: Direct economic losses reduced by approximately 96 million RMB. Average ponding event response time decreased by 51% (from 84 to 41 minutes).
Conclusion and Outlook
This case demonstrates that urban waterlogging management is shifting from empirical judgment to proactive prevention based on radar monitoring and model warnings. For high-density urban areas, integrating meteorological sensing, water affairs models, and emergency response into a single business chain is imperative.
Future plans include expanding radar collaborative observation ranges and introducing a digital twin platform. This will refine details from regional predictions to specific disaster-bearing entities (e.g., building basements, subway entrances), achieving a normalized mechanism of "pre-rainfall prediction, in-rainfall dispatch, and post-rainfall review" to support resilient city construction.

