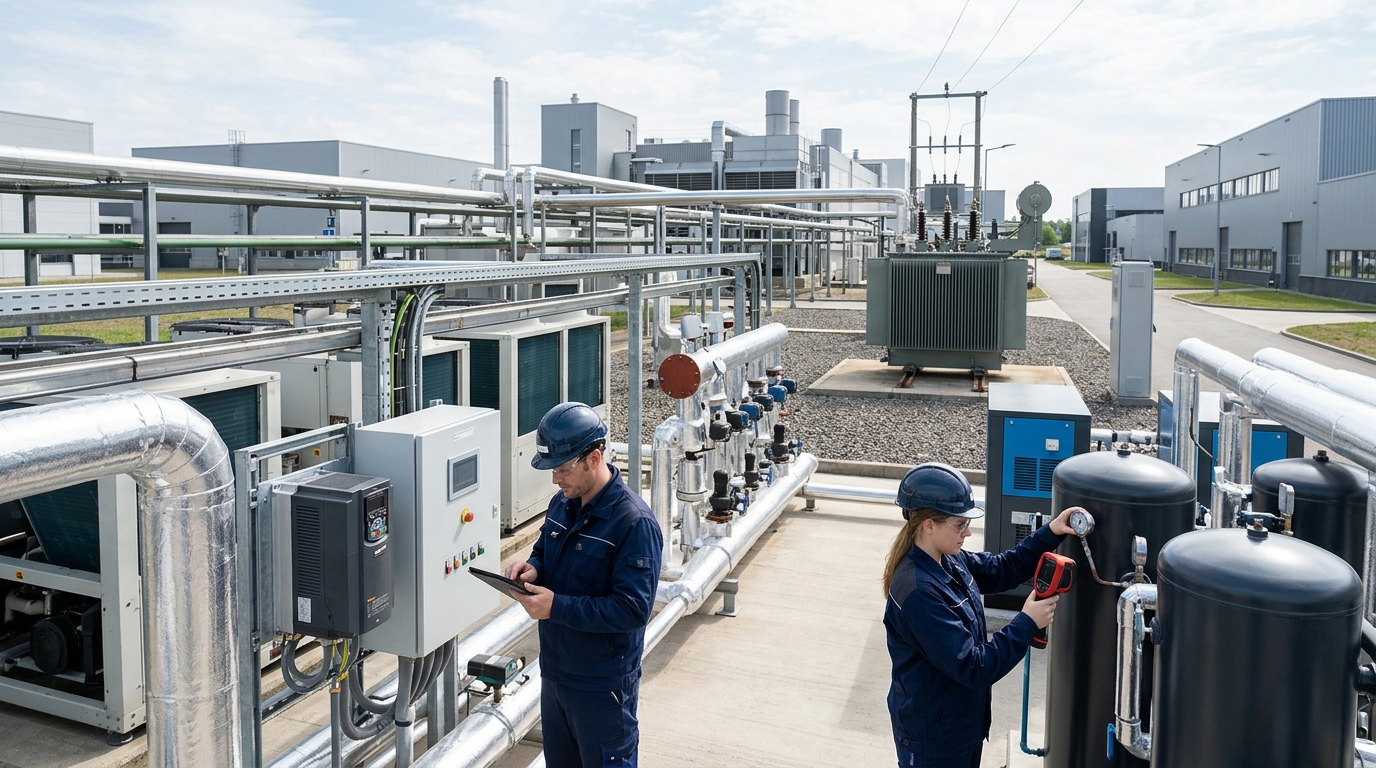
Low-Carbon Park Project in Practice: Carbon Emission Monitoring Application Case
Transforming carbon management from annual ledgers to real-time closed-loop data governance.
Driven by the dual imperatives of the "Dual Carbon" goals and green supply chain disclosure, carbon management for key emitting units is shifting from annual statistics and post-hoc accounting to a paradigm that equally emphasizes online monitoring, process control, and data verification. For high energy-consuming industries such as chemicals, electronic materials, and metallurgy, carbon emissions are not merely the values at a single stack outlet, but a systematic engineering project comprising energy input, process reactions, fugitive emissions, product carbon footprints, and external supply chains.
This article takes the carbon emission monitoring project of an electronic materials and fine chemicals industrial park in the Yangtze River Delta as an example. Led by the park management committee and supported by Yicai Technology, the project established a replicable pathway for park-level carbon emission data governance, initiating diagnostics in July 2023 and completing phased acceptance in December 2024.
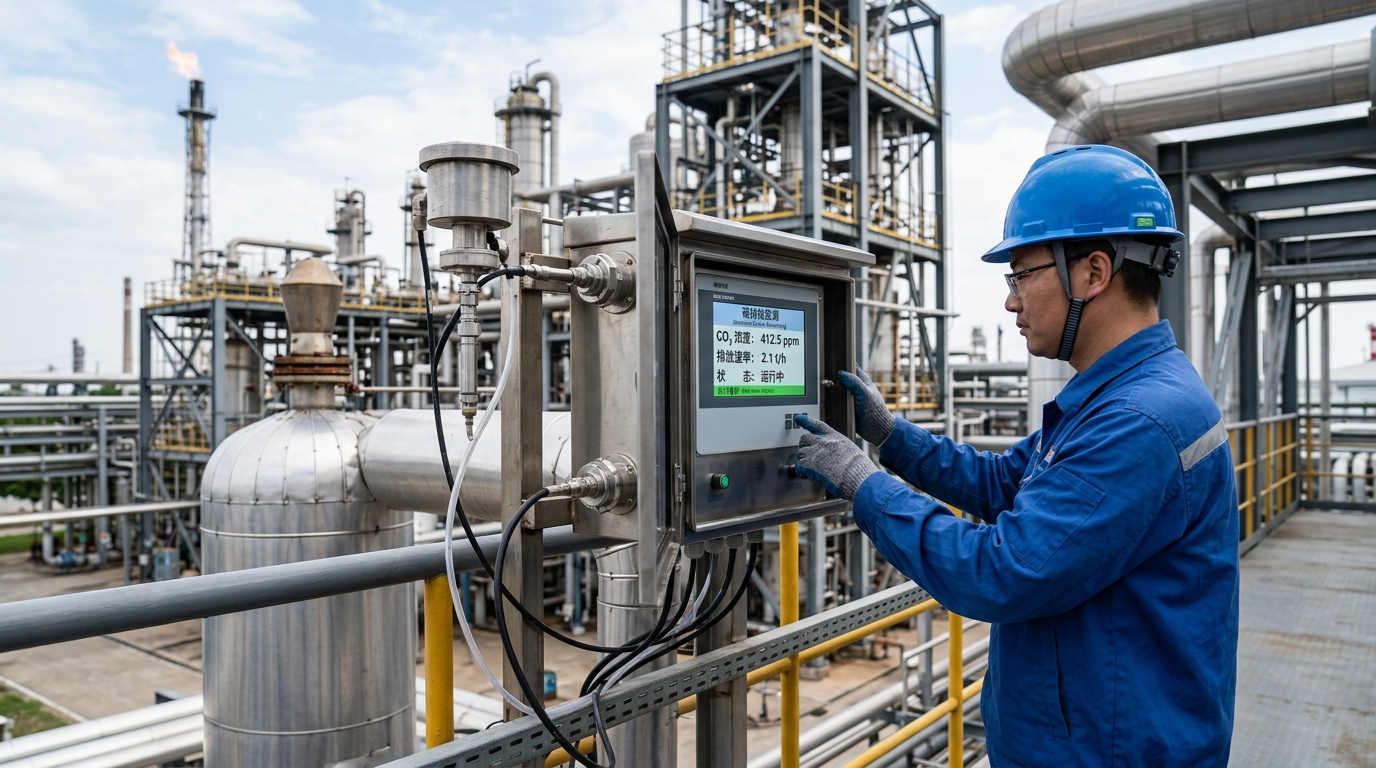
I. Project Background: High Energy-Consuming Parks Face Dual Pressures
Located in a new materials industry cluster in the Yangtze River Delta, the park covers approximately 3.4 square kilometers with 16 enterprises. In 2023, the park achieved an industrial output value of about 5.86 billion RMB, with comprehensive energy consumption of ~47,200 tons of standard coal and total greenhouse gas emissions of approximately 294,000 tons of CO2 equivalent.
The Compliance & Customer Pressure
- Regulatory Pressure: Key emitting units must meet stricter greenhouse gas emission reporting and verification requirements.
- Supply Chain Pressure: Downstream semiconductor and display panel customers require product-level carbon footprint data covering raw materials, energy, processes, waste, and transportation.
Pre-Project Status
- Only 41% of electricity meters had remote transmission capabilities.
- Average time to generate carbon reports: 28 days.
- Inconsistent statistical calibers among enterprises.
Key Metrics (2023)
- Total GHG Emissions: ~294,000 tCO₂e
- Scope 1: ~128,000 tCO₂e
- Scope 2: ~139,000 tCO₂e
- Purchased Steam: ~682,000 tons
II. Technical Challenges: Dispersed Sources & Complex Boundaries
1. Highly Dispersed Emission Sources
The park contains fixed combustion sources (boilers, RTOs) and fugitive sources (tank breathing valves, loading arms). Concentration ranges vary significantly—from 8-12% CO2 in flue gas to ppm-level methane in tank areas—requiring diverse monitoring technologies to avoid data distortion.
2. Boundary Inconsistency
Carbon accounting focuses on organizational boundaries (Scope 1 & 2), while carbon footprinting targets specific products ("cradle-to-gate"). Simple allocation based on production volume fails to identify actual reduction potential or fairly distribute costs among high-value-added products.
3. Data Quality & Verification
Online monitoring requires rigorous validation of sampling representativeness, instrument drift, and data gaps. Dynamic correction of emission factors (electricity, steam, natural gas) based on national standards is essential to prevent systematic deviations in accounting results.
III. Solutions: Integrated System Architecture
The project adopted a roadmap of "metering first, then monitoring, followed by accounting, and finally application," building an integrated system across four layers: Perception, Network, Platform, and Application.
Hardware Deployment Scale
Software & Accounting Models
- Standards Alignment: Based on ISO 14064, GHG Protocol, and ISO 14067, featuring a localized database of 512 emission factors.
- Dynamic Correction: Steam emission factors corrected for boiler efficiency and pipeline losses; electricity factors adjusted for self-generated PV power.
- Product Footprint: Functional unit set as "per kilogram of qualified product," covering cradle-to-gate boundaries excluding employee commuting.
IV. Implementation Process: Four Phases to Data Usability
Diagnostic & Boundary Confirmation (Jul-Sep 2023)
Inventory of 1,286 emission sources and determination of key monitoring units.
Installation & Network Construction (Oct-Dec 2023)
Deployment of edge gateways (Modbus/OPC UA/MQTT) and installation of online monitoring equipment with minimal production disruption.
System Debugging & Data Governance (Jan-Mar 2024)
Establishment of 132 data quality rules. Average 1.86 million valid data entries/day. Triggered 1,042 abnormal work orders for rectification.
Operation Optimization & Verification (Apr-Dec 2024)
Cross-validation of online data with monthly bills and lab analysis. Generated 12 monthly organizational reports and 36 product footprint reports.
V. Data Verification: Cross-Validation Results
Third-party comparative monitoring in Q2 and Q4 2024 confirmed high data accuracy. The average deviation between online monitoring and manual sampling for flue gas CO2 was 1.8%, well within the ±5% target.
"Data verification is not only used to confirm accuracy but also to identify real emission reduction opportunities."
Case Study: Identifying Leaks via Data Anomalies
Steam Trap Leakage Detected (May 2024)
The platform identified abnormally high flow rates in a steam branch pipe. On-site inspection confirmed 3 failed steam traps. Repair reduced steam loss by ~18%.
Methane Fugitive Emissions Reduced (Aug 2024)
Continuous increase in methane concentration in wastewater anaerobic units indicated pipeline leakage. Adjusting fan frequency and repairing water seals dropped fugitive emissions by ~35%, while recovered biogas provided additional energy benefits.
VI. Final Results: Assetization & Economic Benefits
Economic Impact
The project saved approximately 9.5 million RMB in annual energy costs through steam loss reduction, electricity load optimization, and improved natural gas utilization.
- Steam Savings: ~31,000 tons (~5.58 million RMB)
- Electricity Savings: ~2.86 million kWh (~1.94 million RMB)
- Natural Gas Savings: ~620,000 cubic meters (~1.98 million RMB)
With a new investment of ~12.6 million RMB, the static payback period is approximately 1.3 years. Including future benefits from carbon quota management and green finance, the comprehensive ROI is further enhanced.
VII. Conclusion & Outlook
This case demonstrates that the value of carbon emission monitoring lies not merely in installing equipment, but in connecting energy metering, process data, and carbon accounting models to form a verifiable, traceable, and improvable data closed-loop.
Future Expansion Plans
- Supply Chain Integration: Incorporate supplier raw material carbon data into Scope 3 and product footprint models.
- Proactive Early Warning: Introduce electricity load forecasting and process parameter prediction to shift from monthly reviews to proactive management.
- Market Competitiveness: Explore integration with green electricity certificates and carbon quotas to serve production scheduling and market competitiveness enhancement.