Low-Carbon Park Trend Outlook: Carbon Accounting Reshapes Low-Carbon Parks
As China advances its “dual carbon” goals and the EU Carbon Border Adjustment Mechanism enters its transition period, low-carbon parks are shifting from demonstration projects to systemic operations built around carbon accounting, carbon footprint, and online greenhouse gas monitoring.
Introduction: From Demonstration Projects to Systemic Operations
The landscape of industrial parks is undergoing a fundamental transformation. Previously focused on photovoltaics and energy-saving retrofits, the current paradigm centers on carbon accounting, carbon footprint, online greenhouse gas monitoring, and energy-carbon data governance. Publicly stated policy targets indicate that during the 14th Five-Year Plan period, carbon dioxide emissions per unit of GDP will decrease by approximately 18%. By 2030, this figure is expected to fall by more than 65% compared with 2005 levels, with non-fossil energy consumption reaching around 25%.

Unlike the earlier pursuit of a “green park” label, current park managers must answer three fundamental questions: whether emissions data are verifiable, whether product carbon footprints are traceable, and whether decarbonization investments can be translated into lower compliance costs and stronger order competitiveness. According to YiCai Technology’s industry observation, those who can aggregate data from electricity meters, gas meters, steam flow meters, photovoltaic inverters, energy storage systems, production equipment, and logistics vehicles into a unified model will be able to identify high-energy-consumption segments earlier, calculate greenhouse gas emissions more accurately, and participate more flexibly in green electricity trading, carbon market compliance, and supply chain carbon disclosure.
The next round of competition among low-carbon parks will be reflected in data capability and asset operation capability.
Policy and Carbon Market: From Aggregate Targets to Verifiable Boundaries
Policy changes are reshaping the priorities of low-carbon park development. Since the national carbon emissions trading market was launched in 2021, public data show that by the end of 2024, cumulative transaction volume reached approximately 550 million tonnes and transaction value exceeded 40 billion yuan. Covered industries are expanding from power generation to high-emission sectors such as steel, cement, and aluminum smelting. Relevant industries will be included in phases, starting in 2024 with the first compliance cycle in 2025. If resident enterprises fall within regulated sectors, their emission allowances, monitoring, reporting, and verification systems, and data retention requirements will directly affect the park’s overall carbon management responsibilities.
Meanwhile, the EU Carbon Border Adjustment Mechanism entered its transition period in October 2023 and will be formally implemented from 2026, covering categories such as steel, aluminum, cement, fertilizers, electricity, and hydrogen. The overlap of domestic policies on green factories, zero-carbon parks, near-zero carbon emission pilots, ESG disclosure, carbon label pilots, and green certificate trading has transformed park low-carbon projects from voluntary demonstrations into compliance necessities. Over the next two to three years, parks need to establish unified carbon accounting boundaries, clearly defining Scope 1 direct emissions, Scope 2 emissions from purchased electricity and heat, and Scope 3 emissions from supply chains and logistics, while avoiding double counting or omissions.
Key Compliance Shifts
- Transition from voluntary reports to mandatory verification
- Integration of Scope 1, 2, and 3 emissions
- Data granularity supporting trading and order response
Market Impact
- CBAM affecting export-oriented manufacturers
- Carbon price volatility influencing investment decisions
- Green certificates becoming tradeable assets
Carbon Accounting: Park-Level Methodologies Must Resolve Boundaries and Factor Selection
Carbon accounting is the foundational tool for low-carbon parks, but park scenarios are more complex than single-enterprise scenarios. A park boundary may include office buildings, workshops, warehouses, canteens, dormitories, charging stations, wastewater treatment plants, distributed energy stations, and public utility corridors. If accounting is performed only independently by enterprises, it is easy to overlook Scope 2 emissions in shared areas, heat allocation through common steam networks, self-consumption and surplus feed-in from rooftop photovoltaics, time mismatches caused by energy storage charging and discharging, and Scope 3 mobile source emissions from logistics vehicles.
A more robust approach is to establish a four-level accounting model covering park, enterprise, production line, and product, while retaining raw metering data, emission factor versions, and calculation rules in the same database. The selection of emission factors directly affects the results. Electricity emission factors may use the national grid average emission factor, regional grid emission factors, or zero emission factors corresponding to green electricity trading. Using a national grid average emission factor of approximately 0.5703 tonnes of carbon dioxide per megawatt-hour, a medium-sized park with annual electricity consumption of 50 gigawatt-hours would generate approximately 28,500 tonnes of carbon dioxide equivalent in Scope 2 emissions alone. If rooftop photovoltaics generate 4.5 gigawatt-hours per year and are consumed within the park, grid electricity emissions could theoretically be reduced by approximately 2,565 tonnes of carbon dioxide equivalent.

As carbon verification becomes stricter, simple spreadsheet summaries will be insufficient to support long-term compliance. Parks need to embed carbon accounting into energy management systems and manufacturing execution systems so that every kilowatt-hour of electricity, every tonne of steam, and every batch of products can be traced to a verifiable data chain.
Carbon Footprint: From Park-Level Aggregate Indicators to Product-Level Competitiveness
Carbon footprint advances park low-carbon management from aggregate control to product-level management. For export-oriented industries such as electronics, automotive components, textiles, food, and new energy materials, customers often require full life-cycle product carbon footprints rather than only park-level total emissions. According to standards such as ISO 14067 and PAS 2050, product carbon footprints need to cover stages including raw material acquisition, transportation, production, packaging, use, recycling, or disposal. Enterprises within parks may focus only on the manufacturing stage, but downstream order pressure will push Scope 3 data into supply chain platforms.
Case Study: Yangtze River Delta Electronics Park
After introducing product carbon footprint management, the park included unit-product electricity consumption, nitrogen consumption, cleaning solvents, packaging cartons, and transportation mileage for a surface mount technology production line in the calculation.
- Before: Manual collection of >20 forms, ~2 weeks per report.
- After: Automatic aggregation via interfaces, 3–5 days per report.
- Traceability: Improved to >90%.
The difficulty of carbon footprint lies in supply chain data. For major materials that account for more than 60% of a product’s carbon footprint, suppliers can be required to provide batch-level carbon data or third-party reports; for minor materials, default values may be used with uncertainty noted; for transportation, GPS mileage, load, vehicle type, and energy type should be used for calculation, avoiding distance-only estimates.
Online Greenhouse Gas Monitoring: From Annual Reports to Hourly Alerts
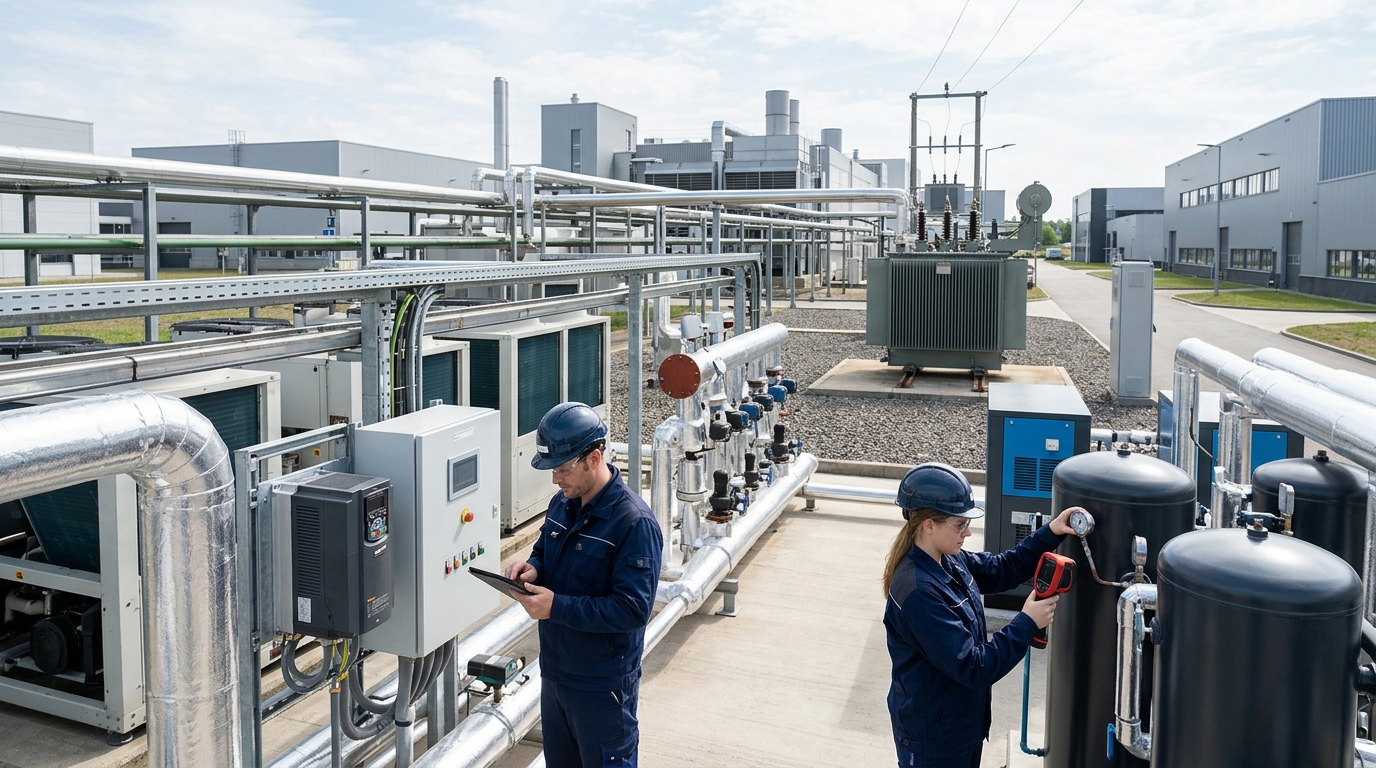
Online monitoring is the key for low-carbon parks to move from after-the-fact accounting to real-time management. Traditional park greenhouse gas management relies on monthly electricity bills, annual fuel ledgers, and manual reporting, resulting in delayed data and difficulty in detecting anomalies. Online monitoring systems typically include smart electricity meters, gas flow meters, steam flow meters, cooling and heating meters, photovoltaic inverter data, energy storage battery management systems, charging pile metering, industrial IoT gateways, and necessary greenhouse gas sensors.

In terms of parameter design, the energy side can collect voltage, current, power factor, active energy, reactive energy, temperature, pressure, flow rate, and cumulative heat; the emissions side can collect indicators related to carbon dioxide, methane, nitrous oxide, refrigerant leakage, and combustion efficiency. Regarding data frequency, production energy use is recommended at 15-minute intervals, photovoltaics and energy storage at minute-level intervals, and carbon accounting aggregation at hourly or daily intervals.
In a pilot at a chemical industrial park, online monitoring reduced the detection time for abnormal energy consumption events from 3 to 5 days to 4 to 8 hours, while metering data completeness improved from about 85% to more than 98%. Key indicators include equipment online rate, data missing rate, outlier proportion, manual review closed-loop duration, and carbon accounting deviation. If monitoring data cannot be converted into control actions, such as automatic alarms, work order dispatch, load shifting, or maintenance planning, the system easily becomes a visualization dashboard and struggles to generate real decarbonization benefits.
Technology Directions: Integrated Energy-Carbon Systems, Digital Twins, and Green Electricity Asset Operations
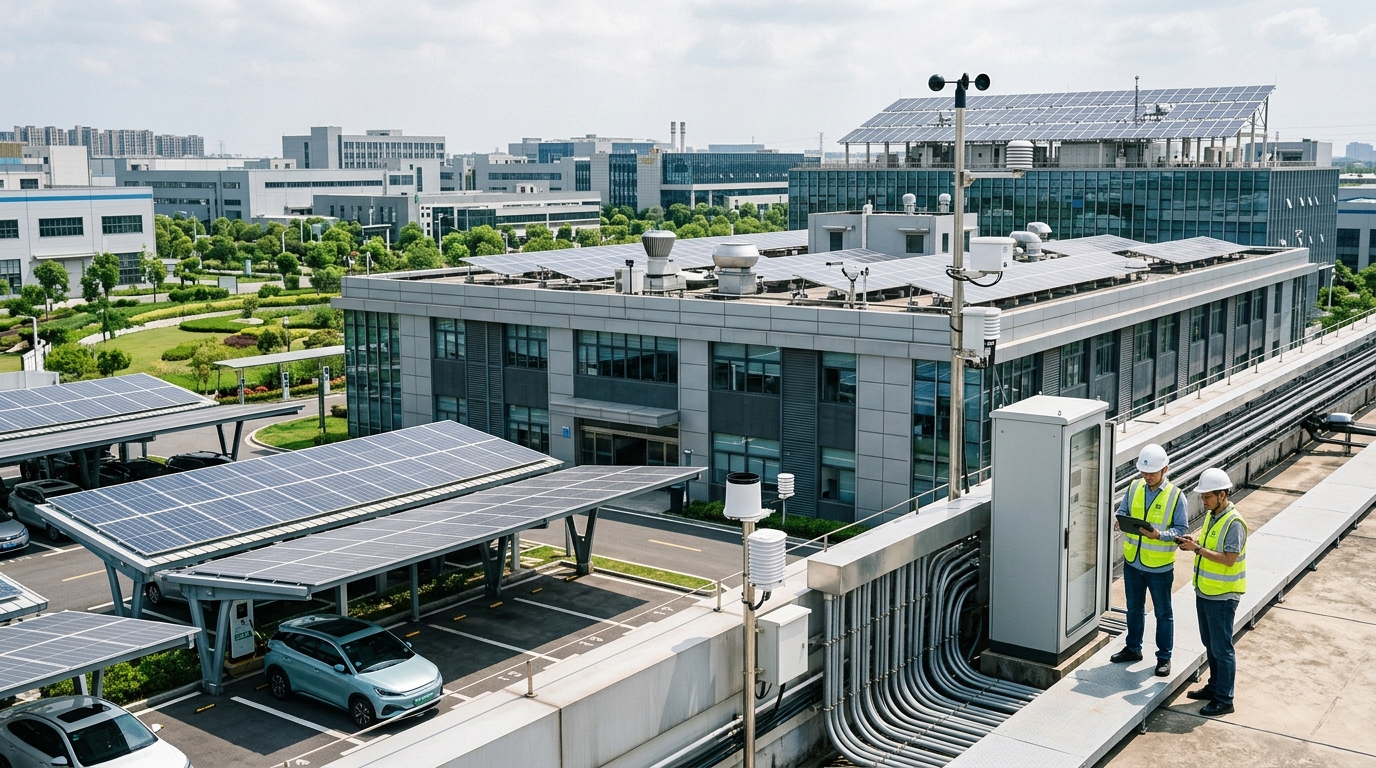
The technology pathway for low-carbon parks is shifting from single-point energy saving to systemic optimization. Energy-side retrofits include rooftop photovoltaics, distributed wind power, energy storage, heat pumps, waste heat recovery, microgrids, and virtual power plant aggregation. Public project experience shows that distributed photovoltaics have annual equivalent utilization hours between 1,000 and 1,600 hours, with each megawatt generating approximately 1 to 1.3 gigawatt-hours per year; commercial and industrial energy storage systems have efficiency of about 85% to 92% and cycle life of more than 6,000 cycles; air-source heat pumps have a heating coefficient of performance of about 2.5 to 4.0, while ground-source heat pumps can reach 3.5 to 5.0.
Digital capabilities include the gradual convergence of energy management systems, carbon management platforms, and production data interfaces. Digital twins can map buildings, pipe networks, production lines, photovoltaics, energy storage, and charging piles into a single model for load forecasting, fault localization, and decarbonization scenario simulation. AI models can predict carbon emission peaks based on historical electricity consumption, temperature, production plans, and equipment status, and provide recommendations for energy storage charging and discharging, air conditioning precooling, peak-shifting production, and photovoltaic consumption, but outputs must retain explainability.
The third category is asset operations, where parks transform from self-consumption energy users into distributed energy aggregators. A logistics park built 1.2 megawatts of rooftop photovoltaics, 1 megawatt-hour of energy storage, and 20 fast charging piles; after electric heavy trucks replaced some diesel vehicles, annual diesel consumption was reduced by approximately 1,000 tonnes, which, estimated using diesel emission factors, could reduce approximately 3,000 tonnes of carbon dioxide equivalent.
Industrial Synergy and Financial Tools: Low-Carbon Parks Need to Convert Data into Credit
One of the difficulties of low-carbon parks is enterprise heterogeneity. A park may simultaneously contain high-energy manufacturing, warehousing and logistics, office research and development, and public services, with significant differences in energy structures, production processes, and willingness to reduce emissions. If retrofits are driven only by the park operator, mismatches may arise among investment entities, benefit entities, and responsibility entities. A more feasible mechanism is to establish park carbon accounts, assigning each resident enterprise records of carbon emissions, energy consumption, green electricity, and carbon assets based on actual metering data, and authorizing the use of such data for green credit, ESG ratings, supply chain audits, and carbon inclusiveness.
In terms of financial tools, green loans, transition bonds, REITs, carbon forwards, green certificate revenue rights, energy performance contracting, and finance leasing can all support park retrofits. Banks and investment institutions focus on data authenticity and cash flow predictability. If a park can provide more than 12 months of continuous energy consumption and carbon emission monitoring data, equipment operating status, electricity settlement records, and decarbonization calculation models, it will be more likely to obtain lower financing costs. Public case studies show that a park packaged financing for rooftop photovoltaics, energy storage, and an energy management system, achieving a project internal rate of return of approximately 6% to 9% and an investment payback period of about 5 to 8 years; if demand response and green electricity trading revenues are added, the payback period can be shortened by 1 to 2 years. Revenue calculations must consider electricity price fluctuations, equipment degradation, operation and maintenance costs, and policy changes.
Outlook: Low-Carbon Park Forms and Governance Priorities for 2030
Toward 2030, low-carbon parks are likely to present four trends. First, carbon accounting will shift from annual reports to real-time ledgers. Each enterprise, each production line, and each batch of products will have a traceable carbon account, with data coming from smart metering, production systems, and logistics systems, allowing verification bodies to conduct remote sampling. Second, product carbon footprints will become routine requirements for exports and supply chain procurement. If parks cannot provide batch-level carbon data, they may lose high-value-added orders; if they can provide credible data, they can form advantages in green procurement scoring, carbon labels, and digital product passports.
Third, energy systems will shift from centralized supply to multi-energy complementarity, with photovoltaics, wind power, energy storage, heat pumps, waste heat, hydrogen demonstrations, and microgrids jointly forming the park’s energy foundation. Fourth, park operations will shift from property management to carbon asset operations. Green electricity, energy savings, carbon allowances, CCER, carbon inclusiveness, and supply chain data may all form tradeable or financeable assets.

For parks, the key is not how many dashboards they own, but whether data can be converted into auditable, tradeable, and financeable low-carbon credit. Maturity is not a zero-carbon slogan, but the formation of stable mechanisms: greenhouse gas emissions can be monitored online, carbon accounting can be verified, carbon footprints can be traced, energy-saving retrofits can be quantified, green electricity assets can be operated, and supply chain data can be shared. The next step should prioritize building data infrastructure and accounting models, then advancing heavy-asset projects such as photovoltaics, energy storage, and microgrids.