Introduction: DMA Zoning and Metering Transforms Leakage Management from Experience-Based to Quantifiable
From March 2023 to June 2025, a water supply group in a prefecture-level city in Central China, in partnership with Yicai Technology, implemented a DMA zoning and metering and leakage control project for the water supply network in the old urban area. The project covers 12.8 square kilometers, a permanent population of 236,000, and 49,000 metered water users, involving 1,862 kilometers of municipal water supply pipelines. Prior to implementation, the total water supply in the area in 2022 was 98.5 million cubic meters, with billed water of 80.1 million cubic meters, network leakage of approximately 18.4 million cubic meters, a leakage rate of 18.7%, and a Non-Revenue Water (NRW) rate of 21.4%.
Upon completion, the area was divided into 186 Level-3 DMA zones and 42 Level-2 assessment districts, with 268 online flow metering points and 312 pressure monitoring points installed. By June 2025, the leakage rate was reduced to 10.9%, saving approximately 6.42 million cubic meters of water annually, pipe bursts decreased by 43%, and the average time for leak localization was shortened from 72 hours to 18 hours. This case demonstrates that network leakage control requires the coordinated advancement of zoning, metering, data analysis, and closed-loop maintenance.
Project Background: Structural Issues Behind High Leakage in the Old Urban Area
The old urban area is the earliest formed mixed residential and commercial zone in the city, with complex underground pipelines. In the water supply network, pipelines in service for over 30 years account for 61%, with grey cast iron pipes, galvanized steel pipes, and early prestressed concrete pipes still constituting a high proportion. 2022 statistics show that pipes with a diameter above DN100 experienced an average of 2.7 visible or hidden leaks per kilometer per year, with leakage particularly concentrated in the branch pipes of some old residential communities.
Operational data indicate that leakage is not an isolated incident. In 2022, the daily average water supply in the area was 269,900 cubic meters, and the average flow from midnight to 4:00 a.m. still reached 31,200 cubic meters, significantly higher than that in newly built urban areas of similar scale. The water supply enterprise had previously conducted manual leak detection and reactive emergency repairs, but due to the lack of zoning and metering data, it was difficult to determine whether the leakage originated from trunk mains, community branch pipes, or unauthorized water use, firefighting, or landscaping.
Leakage also brings direct cost pressures. The comprehensive water production cost at the water plant is approximately 1.68 RMB per cubic meter, and the cost of purchased raw water is 0.92 RMB per cubic meter. Based on the 2022 leakage volume of 18.4 million cubic meters, direct water resource losses exceeded 30 million RMB. Local authorities require the leakage rate of the public water supply network to be controlled at around 10% by 2025; therefore, the water supply group has adopted DMA zoning and metering as a systematic management approach.
Technical Challenges: Missing Data, Complex Boundaries, and Insufficient Metering Accuracy
The project first encountered incomplete baseline data. Some pipelines in the old urban area were built in the 1980s, with as-built drawings missing or inconsistent with actual conditions. Early GIS data only covered trunk mains, and about 34% of branch pipes lacked information on pipe diameter, material, and burial depth. Investigations revealed 217 pipe segments with incorrect attribute data out of the 1,862 kilometers of pipelines, and 286 out of 1,327 valves had operational difficulties or were obstructed by valve chambers.
Secondly, it was difficult to close the water supply boundaries. The old urban area features a multi-source looped water supply system, with 3 booster pump stations and 2 elevated water tanks providing cross-supply, and some communities supplied simultaneously by two municipal mains. Forcibly closing valves could affect end-point pressure; failing to close them would prevent DMA metering from reflecting actual leakage. The project needed to reorganize boundaries and establish meterable inlets and outlets while ensuring water supply safety.
Thirdly, there were challenges with metering accuracy and Minimum Night Flow (MNF) analysis. DMA zoning and metering typically use MNF to assess background leakage, but the old urban area experiences interference from nighttime tank refilling, road washing, landscaping irrigation, and firefighting tests. In some small-diameter pipelines, nighttime flow velocities drop below 0.03 meters per second, where conventional mechanical meters are prone to low-flow measurement deviations, affecting the accuracy of leakage assessment.
Fourthly, data was fragmented. Flow, pressure, emergency repair, meter reading, and revenue data were stored in separate systems, lacking unified timestamps and spatial coding. In the early stage of the project, manually verifying the monthly water balance for a single DMA took 3 to 4 days, making it difficult to track sudden leaks. Without an automated data pipeline, zoning and metering would remain at the reporting level.
Solutions: Three-Level DMA Zoning, Online Metering, and Water Balance Analysis System
The project adopted a three-tier architecture: Level-1 plant outlet metering, Level-2 district assessment, and Level-3 DMA diagnostics. Level-1 metering utilizes the main outlet pipes of water plants and the inlets and outlets of booster stations for total volume control; Level-2 metering covers 42 districts for monthly assessment; Level-3 metering covers 186 DMAs, with each DMA serving an average area of 0.069 square kilometers and approximately 1,270 users, with a maximum of 2,500 and a minimum of 300 users.
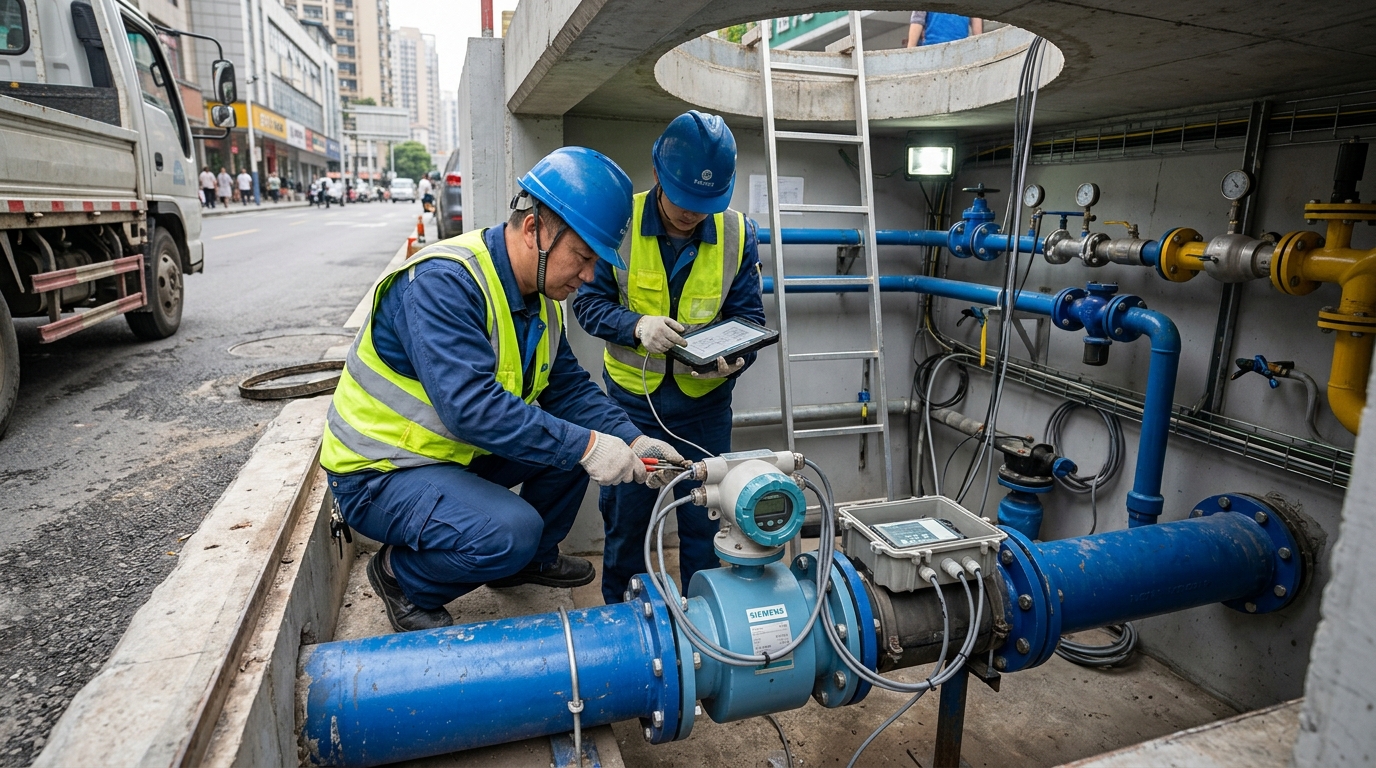
Regarding metering facilities, the project installed 268 online electromagnetic flow meters, including 86 metering points on trunk mains with diameters from DN300 to DN800, and 182 on branch pipes from DN100 to DN200. The trunk main metering points used Class 0.5 electromagnetic flow meters, with Class 0.2 equipment for key assessment points; branch pipe metering points selected electromagnetic or ultrasonic flow meters based on pipe diameter and flow velocity, and conducted low-flow calibration for nighttime low-flow scenarios.
For pressure monitoring, 312 pressure sensors were deployed, covering the most and least favorable points of each DMA, with the sampling frequency adjusted from 15 minutes to 5 minutes. For zoning boundaries, 412 valve chambers were newly built or retrofitted, 286 failed valves were replaced, and 97 unnecessary connecting pipe segments were sealed. Independent metering or smart hydrants were installed on dedicated pipelines for firefighting and landscaping to ensure each DMA forms a single or controllable inlet and outlet.
For the data platform, the project developed a DMA zoning and metering management platform, integrating flow, pressure, meter reading, revenue, emergency repair work orders, and network GIS. Following the IWA water balance framework, the platform breaks down the total water supply into authorized metered consumption, authorized unmetered consumption, apparent losses, and real losses. Each DMA generates daily indicators such as Minimum Night Flow, leakage volume per unit pipe length, leakage volume per unit service area, and pressure compliance rate.
Implementation Process: From Network Census to Closed-Loop Operation
The first phase was the network census and data governance, from March 2023 to July 2023. The technical team completed the verification of 1,862 kilometers of pipelines, corrected 86,000 pipe segment attributes, supplemented 1,264 branch pipe records, and repaired or recalibrated 1,327 valves. This phase established a "single map" foundation, providing a basis for zoning boundary design.
The second phase was pilot validation, from August 2023 to January 2024. The project selected the Chaoyang Street area to build 8 DMAs, installing 46 flow meters and 52 pressure monitoring points. After two months of pilot operation, the MNF in the Chaoyang Street area dropped from 28.6 to 17.2 cubic meters per hour. Specifically, DMA03 showed a stable nighttime flow of 9.4 cubic meters per hour; using an acoustic correlator for localization, a hidden leak was found beneath a DN300 grey cast iron pipe, and after repair, the daily leakage volume was reduced by approximately 456 cubic meters.
The third phase was comprehensive construction, from February 2024 to December 2024. The project proceeded according to the principle of "boundaries first, then internals; trunk mains first, then branch pipes," completing metering installation and boundary closure for 186 DMAs. Of the 268 metering chambers, 194 were constructed at night, with single-point construction time controlled within 6 hours. After each flow meter was installed, a 72-hour zero drift test and comparative calibration were conducted.
The fourth phase was operational optimization and leakage closed-loop management, from January 2025 to June 2025. The platform established a "monitoring—alerting—on-site verification—repair—review" process. In the first half of 2025, a total of 217 leakage alerts were generated, confirming 139 real losses, 31 apparent losses, 9 cases of unauthorized water use, and 38 cases of abnormal firefighting or landscaping water use. The accuracy rate for repair excavation reached 86%, and the average time for leak localization was shortened to 18 hours.
In terms of pressure management, the project implemented pressure reduction control for 12 high-leakage DMAs, reducing the nighttime water supply pressure from an average of 0.34 MPa to 0.28 MPa, while ensuring that the pressure at the most unfavorable point remained no less than 0.16 MPa. After pressure optimization, the MNF in these DMAs decreased by an average of 12.4%. The project also established a monthly water balance audit system to verify metered water volumes, revenue water volumes, and unmetered water use, avoiding misjudgments caused by metering errors.
Data Verification and Final Results: Leakage Rate Reduced from 18.7% to 10.9%
The project results were verified through 12 consecutive months of operational data. Prior to the renovation, in 2022, the total water supply in the area was 98.5 million cubic meters, billed water was 80.1 million cubic meters, leakage was approximately 18.4 million cubic meters, the leakage rate was 18.7%, and the NRW rate was 21.4%. By the end of 2024, the total water supply was 97.65 million cubic meters, billed water was 84.12 million cubic meters, leakage was 12.51 million cubic meters, and the leakage rate was 12.8%.
After annualizing the operational data from January to June 2025, the total water supply was approximately 97.2 million cubic meters, billed water was 83.6 million cubic meters, leakage was approximately 10.6 million cubic meters, and the leakage rate was 10.9%. Structurally, real losses decreased from approximately 15.2 million cubic meters to about 8.3 million cubic meters, a reduction of 6.9 million cubic meters; apparent losses decreased from approximately 3.2 million cubic meters to about 2.3 million cubic meters.
Among the 186 DMAs, 121 had a leakage rate below 10%, accounting for 65.1%; 47 had a leakage rate between 10% and 15%; 18 DMAs still had a leakage rate above 15% due to poor pipe material or limited construction conditions, and have been included in the next year's renewal and renovation plan. The number of pipe bursts in the area dropped from 312 in 2022 to 178 in the first half of 2025, representing an approximate year-on-year decrease of 43% on a half-year basis.
In terms of service quality, the network pressure compliance rate increased from 96.2% to 99.1%, and low-pressure complaints decreased from an average of 47 per month to 12. The completeness rate of online metering data reached 99.3%, and the availability of flow and pressure data met daily dispatch requirements. In terms of economic benefits, calculated at a comprehensive water production cost of 1.68 RMB per cubic meter, the annual water savings of 6.42 million cubic meters correspond to water production cost savings of approximately 10.78 million RMB. The project investment was approximately 68 million RMB, with a static payback period of about 6.3 years.
Industry Insights and Outlook: DMA Zoning and Metering Requires Long-Term Operational Mechanisms
This case demonstrates that the value of DMA zoning and metering lies not in the installation of individual devices, but in forming a management system that is "zonable, meterable, diagnosable, and closed-loop." Key factors for the project's success include completing the network census and data governance before defining zoning boundaries; rationally selecting metering equipment based on pipe diameter and flow velocity; combining MNF analysis with pressure, work order, and revenue data; and establishing on-site verification and repair review mechanisms following alerts.
Looking ahead, leakage control in urban water supply networks will evolve towards refined, real-time, and asset-based management. With the development of acoustic monitoring, pressure transient analysis, digital twin, and smart metering technologies, DMA zoning and metering is expected to advance from "daily-level diagnostics" to "hourly-level diagnostics" and achieve leakage risk prediction. The practice of technical entities such as Yicai Technology participating in this project shows that only by integrating zoning and metering with network renewal, pressure management, and O&M mechanisms over the long term can urban water supply systems strike a balance among safety, energy efficiency, and sustainability.

