How a Water Utility Group Achieves Cost Reduction and Efficiency Improvement through Drainage Network Monitoring
Case Study: Urban Flood Prevention & Smart Water Management
Introduction: Online Monitoring Becomes the "Front-End Sensing Layer"
In recent years, the increase in extreme short-duration heavy rainfall has posed greater challenges to urban drainage systems. In the past, drainage network management relied heavily on manual inspections and post-rainfall response, making it difficult to promptly monitor changes in liquid level, flow rate, and overflow. Establishing an online monitoring system around indicators such as drainage, liquid level, flow rate, and flood prevention is becoming an important direction for the refined management of urban water affairs.
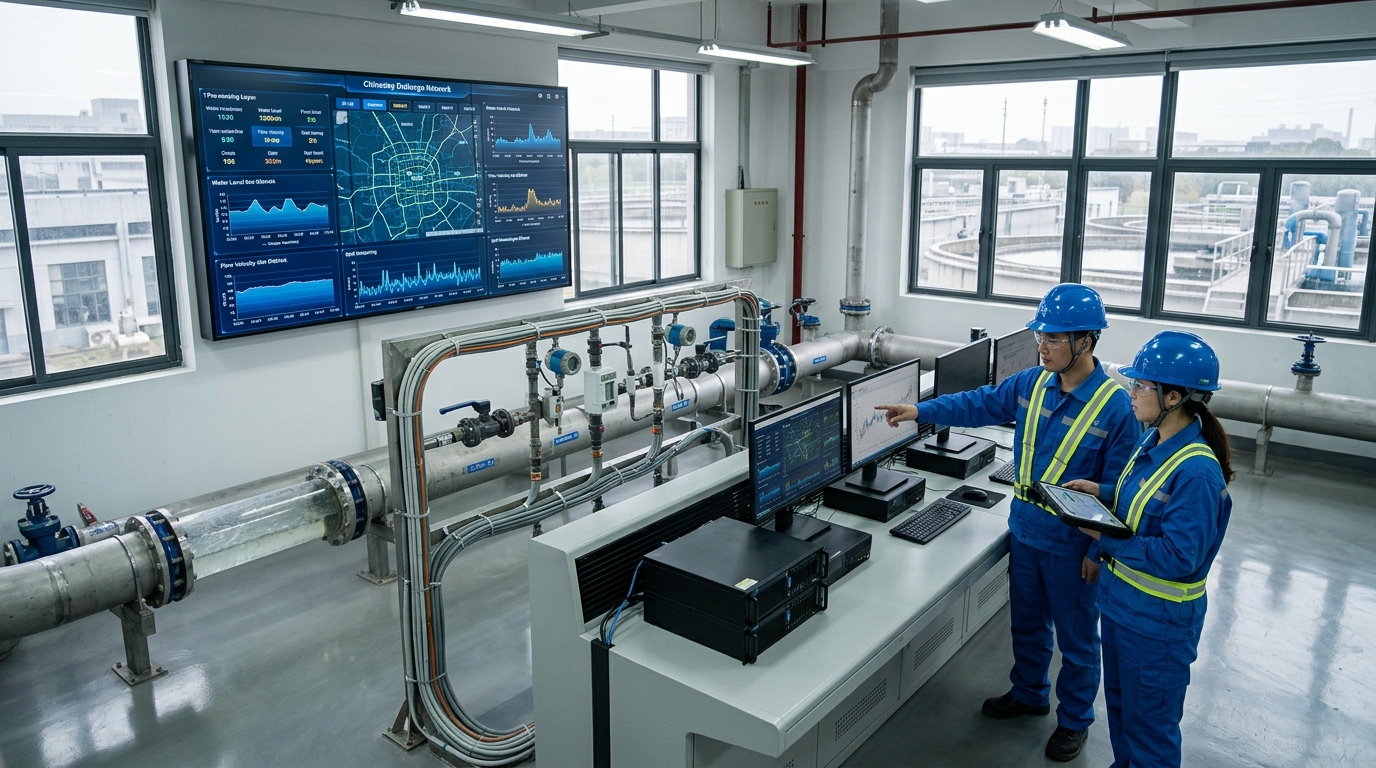
In October 2023, a coastal city in East China launched an online monitoring and flood prevention early warning project for the drainage network in its central urban area. The project covers 42.6 square kilometers of key catchment areas, involving 386 kilometers of drainage networks, 12,680 manholes, 23 flood-prone points, and 14 underpasses. Yicai Technology, as the technical support unit, participated in equipment selection, platform integration, and early warning rule design. Before the flood season in 2024, the project completed the data integration of 486 liquid level monitoring devices, 218 flow monitoring devices, 32 rain gauges, 58 waterlogging monitoring points, and 12 pump stations.
Project Background: Old Towns Under Pressure
The built-up area of the central urban area of this city is about 86 square kilometers, with a permanent population of approximately 1.12 million. The drainage networks in the old town were built early, with the design return period of stormwater sewers mostly ranging from 1 to 3 years, and some areas still operating under a combined sewer system. The total length of the drainage network in the central urban area is about 1,243 kilometers, including 762 kilometers of stormwater sewers, 418 kilometers of sanitary sewers, and 63 kilometers of combined sewers, along with 12 stormwater pump stations and 96 stormwater outfalls.
During the flood seasons from 2021 to 2022, a total of 47 significant waterlogging events were recorded, causing 18 road traffic interruptions. The average waterlogging depth was about 22 centimeters, with a maximum depth of 46 centimeters.
Due to the lack of liquid level and flow rate data in the pipeline network, management departments could often only determine the causes after the fact, making it difficult to distinguish between pipeline blockages, outfall backwater effects, insufficient pump station capacity, or excessively rapid upstream inflow, resulting in a relatively passive flood control dispatch.
Technical Challenges: Complex Working Conditions
The project implementation faced multiple technical challenges. First, the underground environment is complex, with manhole depths mostly ranging from 3 to 7 meters, high humidity, and abundant corrosive gases; some locations pose risks of hydrogen sulfide and methane. Sensors need to operate long-term without mains power and under weak signal conditions, requiring high protection ratings, explosion-proof performance, and battery life. Second, the stability of liquid level and flow rate monitoring is insufficient; foam, floating debris, inflow impact, and backflow in the manholes can all affect data accuracy.
A greater challenge lies in data synergy. Urban waterlogging is not only related to rainfall but also affected by pipeline network liquid levels, river water levels, pump station operations, and the topography of underpasses. Prior to the project, rainfall, pump station, video, and river water level data were scattered across different systems with inconsistent update frequencies, making comprehensive analysis difficult. Relying solely on single-point threshold alarms can easily lead to false or missed alarms. The project needed to establish a correlation analysis mechanism among liquid level, flow rate, rainfall, and waterlogging depth to support flood prevention early warning.
Solutions: "Liquid Level + Flow Rate + Rainfall + Waterlogging + Dispatch"
The project adopted a scheme of "sensing at key nodes, classified equipment configuration, unified platform aggregation, and tiered early warning dispatch". For liquid level monitoring, 486 points were deployed using a combination of radar, ultrasonic, and pressure-type liquid level sensors, with a measurement range covering 0 to 8 meters and an error controlled within ±1 centimeter. For flow rate monitoring, 218 points were set up; Doppler ultrasonic flow meters were used for non-full-pipe gravity flow sections, with a flow velocity measurement range of 0.03 m/s to 5.0 m/s; electromagnetic flow meters with an accuracy class of 0.5 were used for pump station discharge pipes and full-pipe sections.
Key Implementation Details
- Flood Prevention Monitoring: 58 waterlogging monitoring devices deployed at flood-prone points, underpasses, and low-lying intersections (0-3m range, 1mm resolution).
- Rainfall Integration: 32 rain gauges integrated with 0.2mm resolution.
- Data Frequency: Every 15 minutes (sunny), every 5 minutes (rain), every 1 minute (emergency).
- O&M Automation: Platform automatically flags disconnected/drifting data and generates work orders within 30 seconds.
- Warning Logic: "Threshold + Trend + Model". E.g., Liquid level >80% triggers yellow warning; Road waterlogging >25cm triggers traffic control.
Implementation Process: From Survey to Trial Operation
Oct-Nov 2023: Basic investigation completed. Reviewed 386 km of pipelines, sampled 1,860 manholes to confirm depth, diameter, and flow direction.
Dec 2023-Feb 2024: Equipment installation. Strict adherence to confined space entry permits (gas detection, ventilation). Low-power devices powered by lithium batteries and solar supply, using NB-IoT/4G/Fiber communications.
March 2024: System integration testing. Platform integrated 12 types of data, adding ~58,000 records daily. Conducted 72-hour continuous comparisons, corrected installation deviations, handled 137 communication anomalies, and optimized 62 low-signal points. Manual comparison showed an average deviation of only 1.4 cm.
April 2024: Trial operation began. Trained 56 O&M personnel and conducted tabletop exercises simulating underpass waterlogging and pump station failure scenarios.
Final Results: Significant Efficiency Gains
From June to September 2024, the project experienced its first complete flood season. The platform cumulatively received about 18.6 million monitoring data records, generated 317 early warnings, and confirmed 291 valid warnings after on-site verification, achieving a valid warning rate of 91.8%.
Flood Prevention Effect
- Avg waterlogging depth decreased from 22cm to 14cm.
- Max waterlogging depth decreased from 32cm to 18cm.
- Recession time shortened by 41% (138min to 81min).
- Traffic interruptions dropped from 11 to 3.
Operational Efficiency
- Sanitary sewer overflow complaints decreased by 26%.
- Manual inspection frequency decreased by 38%.
- On-site verification workload decreased by 31%.
- Equipment online rate: 99.2%.
Case Study: On July 12, 2024, during a 60mm/h rainfall event, the platform triggered an orange warning at 14:26 for rising underpass water levels. Traffic control was initiated at 14:35, pump station dispatch strengthened at 14:52, and water levels receded to safe levels by 15:40.
Industry Insights: From "Visibility" to "Accurate Calculation"
This project demonstrates that the value of drainage network monitoring is not just about "seeing the data", but transforming liquid level, flow rate, rainfall, and waterlogging information into a basis for dispatch. Through continuous monitoring, management departments can identify blockages, overflows, and waterlogging risks earlier, and accumulate pipeline network operational data to support subsequent renovations, pump station expansions, and sponge city construction.
In the future, with the further integration of weather forecasting, hydraulic models, and artificial intelligence analysis, drainage and flood prevention will move from single-point alarms to area-wide predictions, and from passive response to proactive dispatch. The central urban area of this city plans to expand the monitoring scope to 1,243 kilometers of major drainage networks by 2027, gradually forming an urban drainage and flood prevention operation system of "5-minute perception, 15-minute analysis, and 30-minute response."

