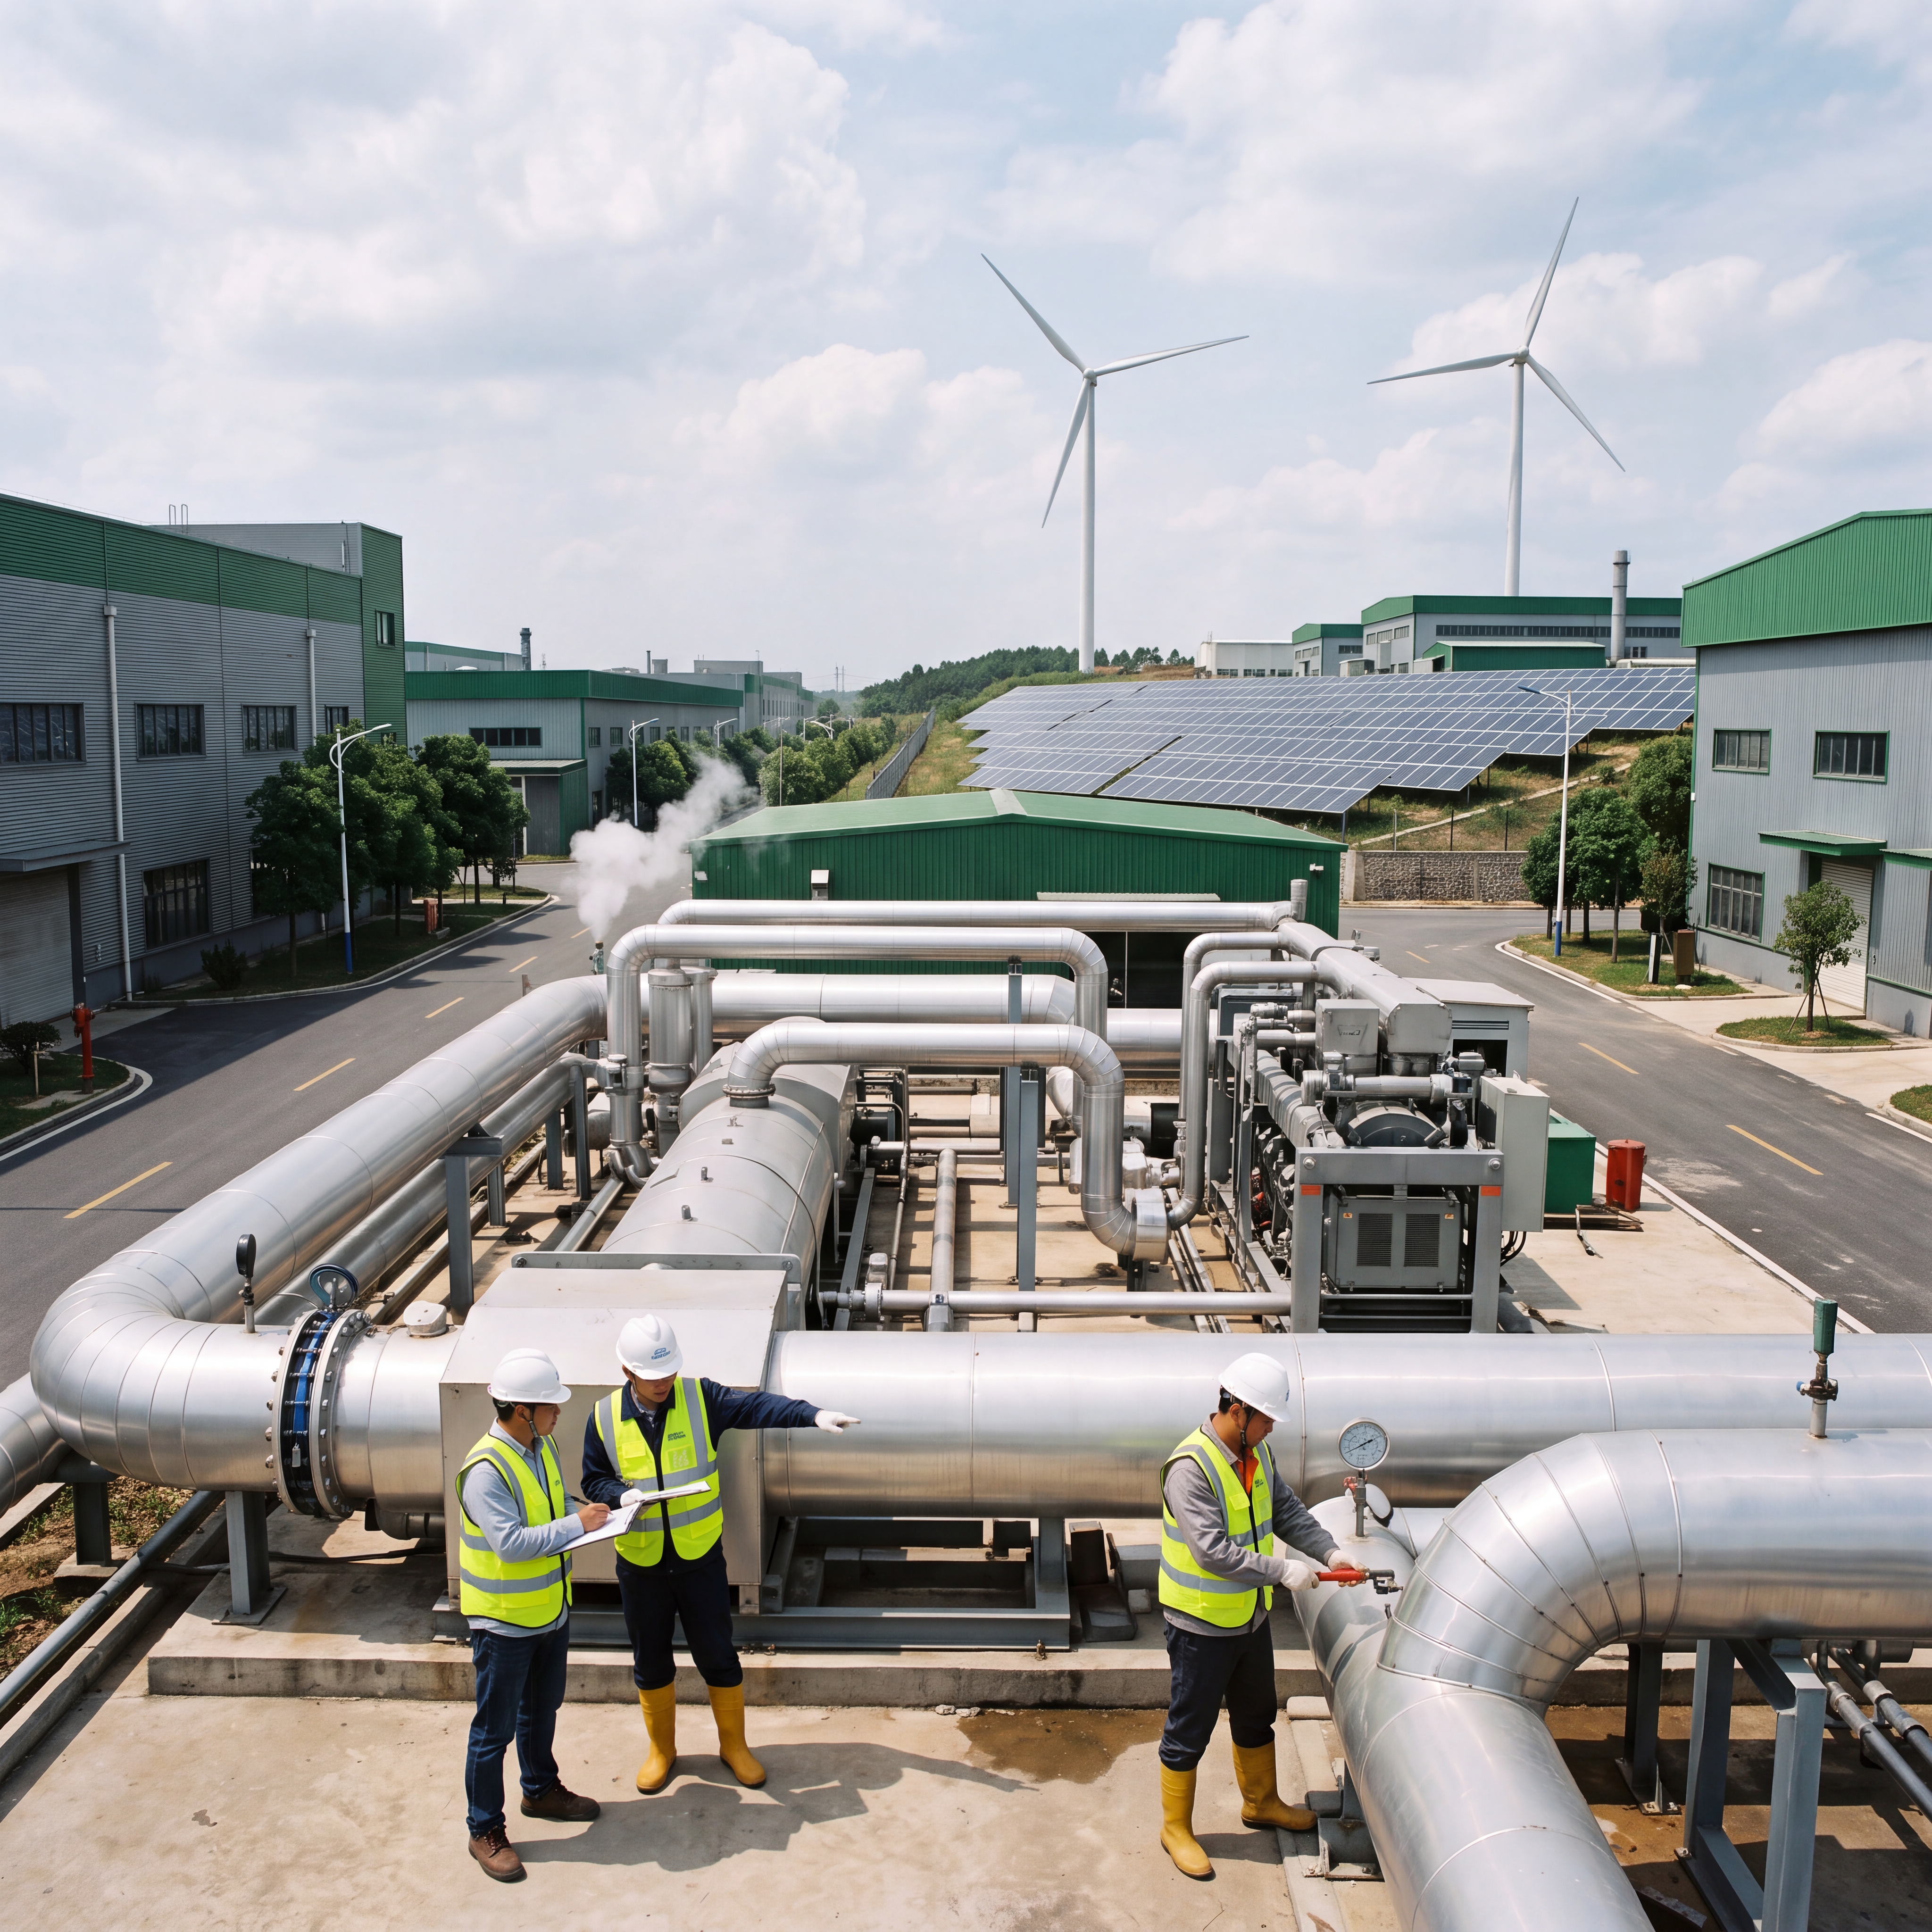
Green Low-Carbon Industrial Park: Carbon Monitoring Beyond Compliance
Smart water instrumentation is no longer just about flow accuracy—it’s the foundational layer for industrial carbon footprint traceability. In green low-carbon industrial parks, precise water measurement enables quantification, verification, and reduction of emissions at the process level—transforming compliance into competitive advantage.
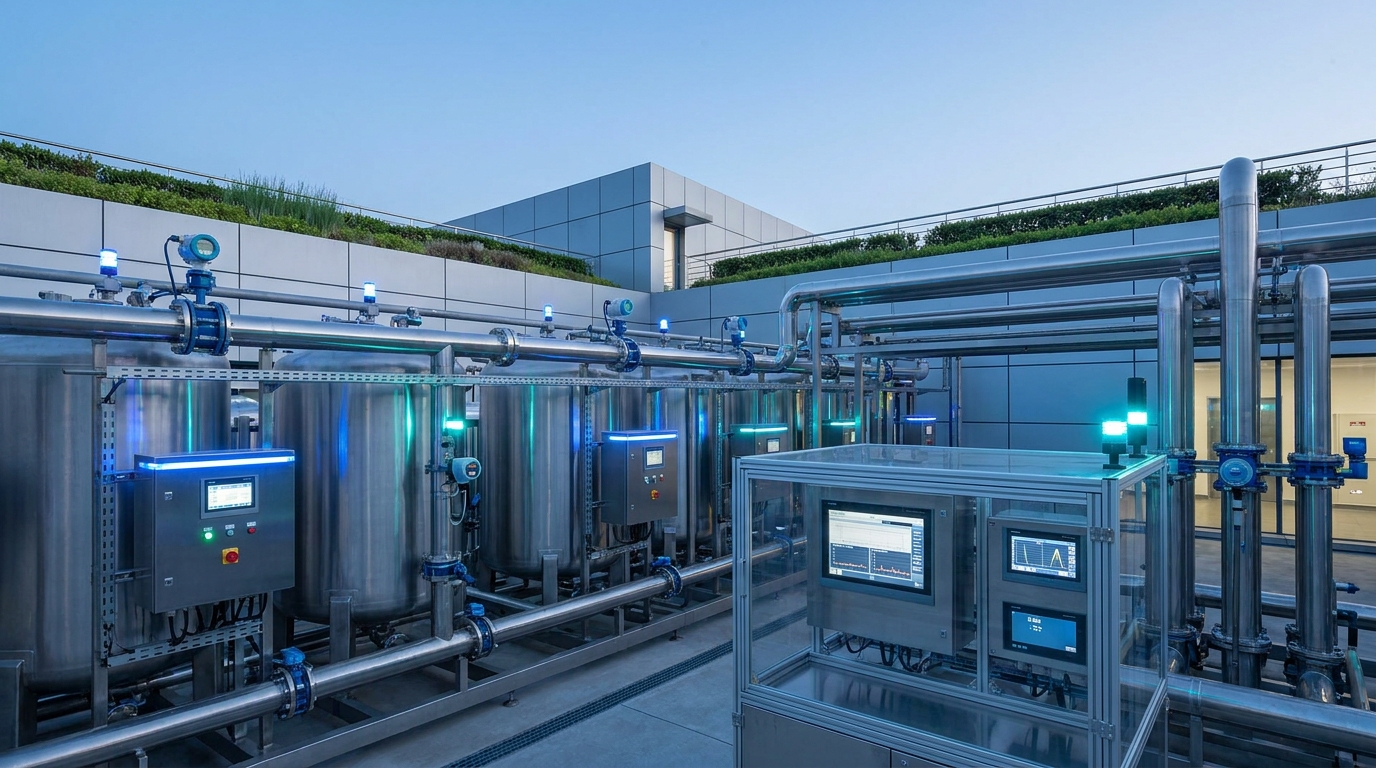
The Data Gap in Industrial Decarbonization
Global industrial carbon emissions account for 24.2% of total CO₂ (IEA 2025), yet over 68% of manufacturers lack granular, real-time energy-water-carbon linkage. As Analytics Insight reports, IIoT adoption in energy-intensive sectors grew only 31% YoY in 2025—lagging behind manufacturing (52%) and logistics (47%) due to fragmented sensor interoperability and legacy infrastructure.
Without precise water-use data—especially in cooling, steam generation, and wastewater treatment—carbon accounting remains an estimate, not evidence. This gap undermines green low-carbon industrial park certification and voluntary carbon credit eligibility.
Why Water Flow Is the Silent Carbon Proxy
Water and carbon are thermodynamically entangled. In thermal power plants, every cubic meter of cooling water circulated consumes ~0.8 kWh of pumping energy—translating to ~0.4 kg CO₂e when grid-mixed. In chemical parks, steam condensate return rates directly correlate with boiler fuel efficiency: a 10% improvement cuts natural gas use by 7–9%.
Yet most carbon monitoring tools ignore this nexus. The Analytics Insight 2026 IIoT Use Cases Report confirms that only 12% of deployed IIoT systems integrate water instrumentation with energy or emissions analytics—a critical blind spot for green low-carbon industrial park certification.
“Carbon credits require auditable, process-level data—not facility-wide averages. If you can’t measure water volume, velocity, and temperature at the heat exchanger inlet, your Scope 1 & 2 attribution is statistically unverifiable.”
— Evoca’s ISO 14067-certified Product Carbon Footprint Framework, 2025
Three Instrumentation Levers for Verified Carbon Tracking
Industrial carbon footprint tracking demands three synchronized capabilities: precision measurement, energy-contextualization, and environmental resilience. These aren’t abstract requirements—they’re hardware specifications engineered for carbon accountability.
LGF Electromagnetic Flowmeter
PA66 bio-based housing • ±0.25% accuracy • 0.3 m/s min velocity
- • 41% lower embodied carbon vs. stainless steel (ISO 14040 LCA)
- • Detects micro-leaks: 2 mm orifice → 1.8 tons CO₂e/year saved
HERO V9 RTU
Dual-channel pulse + Class 0.5 CT inputs • Grid-aware carbon intensity
- • Synchronizes water volume + real-time kW draw
- • Outputs kWh/m³ metrics compliant with SL651-2022 Annex D
Visual Fusion Radar Level Sensor
80 GHz + HD imaging • ±1 mm precision • AI validation
- • 98.3% uptime in monsoon vs. 71% for ultrasonics
- • 5% level control improvement → 14% aeration energy reduction
From Measurement to Market: Carbon Credits Meet Hardware
The 2026 Carbon Credits Guide reveals a pivotal shift: voluntary markets now demand device-level timestamped data—not aggregated monthly logs—for credit issuance. Projects using certified IoT sensors saw 3.2× faster verification cycles and commanded +17% premium pricing on compliance platforms like China’s National Carbon Trading Market (NCET).
At Ecolor Technology, our SITUMAN-sourced LGF and HuaYu ZhongNeng-integrated HERO V9+radar deployments generate audit-ready CSV/JSON streams with SHA-256 hash signatures—meeting ISO 14064-3 verification protocols out-of-the-box.
- ✓ LGF: NTP-synced UTC timestamps + device serial + firmware version
- ✓ HERO V9: kWh/m³ carbon intensity via MQTT to NCET-compliant gateways
- ✓ Visual Fusion Radar: Environmental confidence score (0–100%) per reading
Real Deployment: A 2025 Green Low-Carbon Park Case Study
In Hangzhou’s Yuhang Eco-Industrial Park, 14 LGF-PA66 units (DN80–DN300) were installed across cooling towers and boiler feed lines, paired with HERO V9 RTUs monitoring 22 pumps. Visual fusion radar sensors monitored 8 wastewater equalization basins.
11-Month Impact Summary
-
✓
3 undetected condensate leaks
4.7 m³/h → 3,200 tons CO₂e/year saved -
✓
11 pump runtime optimizations
Avg. 22% load reduction → 1,850 MWh/year saved -
✓
98.3% uptime in monsoon season
vs. 71% for legacy ultrasonic sensors
All data was accepted by the Zhejiang Provincial Ecology Department for its 2025 Green Park Certification—validating the “See What You Measure” principle as operational reality.
See What You Measure
Ready to anchor your green low-carbon industrial park with verified carbon monitoring?
- • Procurement managers: Prioritize devices delivering traceable, time-synchronized, energy-contextualized water data—not just flow counts.
- • Water utility engineers: Remember—carbon neutrality starts where water enters and exits your process.
- • Project managers: Interoperability isn’t optional—it’s the difference between a carbon report and a carbon credit.
Ecolor Technology’s integrated stack—engineered in Hangzhou, validated in real Chinese industrial conditions—turns water instrumentation into your most credible carbon witness.