How a Water Utility Group Achieves Cost Reduction and Efficiency Improvement Through Industrial Park Energy Management
Industrial Energy Solutions | Case Study
Introduction: From "Extensive Accounting" to "Closed-Loop Control"
Under the dual pressure of "dual carbon" goals and the need for cost reduction in manufacturing, industrial park energy management is shifting from traditional manual meter reading to real-time monitoring and operational optimization. A smart manufacturing park in East China has built an EMS (Energy Management System) to integrate energy data, equipment operation, and production plans into a unified platform.
Key Results:
- Comprehensive energy consumption decreased by 14.6%.
- Annual energy cost savings reached approximately 12.86 million RMB.
- Carbon emission intensity dropped by 15.2%.
Located in the Yangtze River Delta manufacturing cluster, the park covers 685,000 square meters with 43 enterprises. Originally featuring isolated systems for power, gas, steam, and HVAC, the retrofit focused on addressing insufficient metering, peak load spikes, and low equipment efficiency. The project ran from March 2023 to June 2024, establishing a closed loop of "monitoring—diagnosis—optimization—execution—accounting."
Project Background: High Intensity & Dual Carbon Pressure
The park's power distribution system includes 12 transformers with a total capacity of 42.6 MVA. Pre-retrofit energy audit data (2022) showed annual electricity consumption of ~118 million kWh and comprehensive energy consumption equivalent to 19,200 tons of standard coal. This was over 10% higher than the regional average for advanced manufacturing parks.
Energy Costs
Energy costs accounted for nearly 8% of operating expenses, with annual electricity expenditures around 86 million RMB.
Carbon Emissions
Scope 1 and Scope 2 emissions were ~50,800 tons of CO2. Lack of online metering made refined management difficult.
Challenges included high demand charges due to summer peak loads of 28.6 MW, inefficient air compressor operations, and low chiller plant COP. The lack of data support prevented effective energy-saving interventions.
Technical Challenges: Multi-Energy Coordination
The project faced three major hurdles:
- Data Silos: Over 15 independent subsystems used various protocols (Modbus, BACnet, etc.). Key sub-metering coverage was only 58%.
- Load Prediction: Complex coupling between electrical loads, HVAC, and production schedules required cross-system coordination to avoid inefficiencies like excessive pressure settings or low chilled water temperatures.
- Safety & Continuity: Optimization strategies had to ensure process stability, requiring safety boundaries and fallback mechanisms for critical equipment like chillers and compressors.
Solution: Integrated "Source-Grid-Load-Storage-Carbon" Platform
The solution centers on an EMS hub building a four-tier architecture: Perception, Edge, Platform, and Application.
1. Perception Layer
Added/replaced 286 smart electricity meters, 152 water meters, and deployed sensors for temperature, pressure, and flow. Total connected points reached ~12,600, covering power (46%), HVAC (22%), and PV/Storage (15%).
2. Edge Layer
36 edge gateways handled protocol conversion and data cleaning. Critical power circuits were sampled at 1-second intervals. Data completeness improved from <80% to 99.2%, enabling automatic fault detection.
3. Application Layer
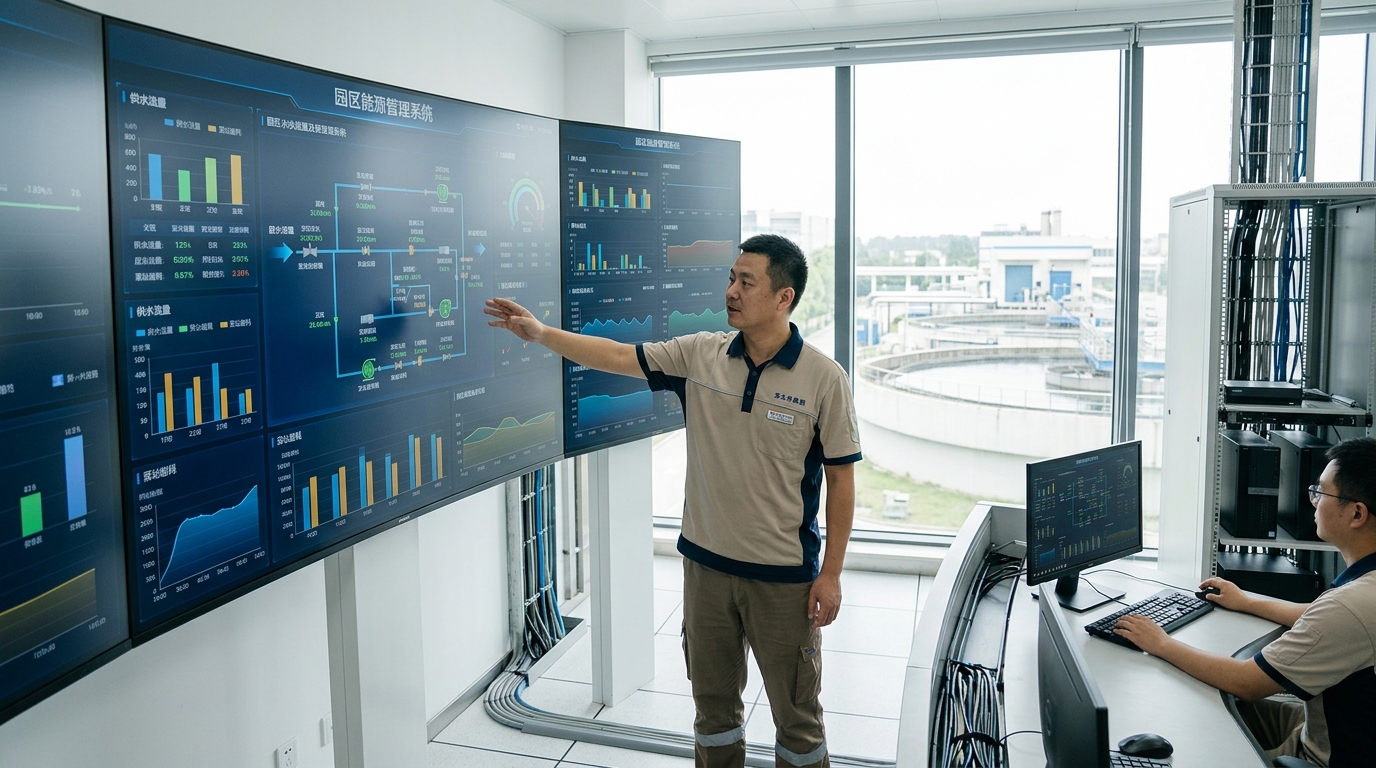
Modules include energy cockpit, load prediction, equipment diagnosis, and carbon accounting. The platform establishes a five-level energy model (Park → Enterprise → Building → System → Equipment).
Control Strategy: "Suggestion first, closed-loop later." Operators confirm suggestions initially; once stable, automatic control is enabled for chillers, lighting, and storage. Local manual priority is retained for safety.
Implementation Process & Typical Scenarios
The rollout followed a phased approach: Metering Completion (Apr-Aug 2023), Efficiency Diagnosis (Sep-Dec 2023), and Trial Operation (Jan-Jun 2024). Metering coverage increased from 58% to 96%.
Chiller Plant Optimization
Dynamic optimization of unit count, supply temp, and pump frequency based on load prediction.
Result: COP increased from 3.2 to 4.1. Summer electricity use down 22.4%.
Air Compression Group Control
Optimized pressure band (0.63–0.68 MPa) and identified network leaks during low-load periods.
Result: Energy saving rate 18.7%. Annual savings ~5.12 million kWh.
Smart Lighting
Zone dimming based on natural light, human presence, and vehicle traffic.
Result: 35.2% energy saving. Annual savings ~2.18 million kWh.
PV & Energy Storage
Coordinated 3.2MW PV with new 2MW/4MWh storage for peak shaving and arbitrage.
Result: Demand charge savings ~2.36 million RMB. Self-consumption up to 91%.
Final Results: Comprehensive Benefits
Based on 12 months of operational data, the project achieved significant improvements across all metrics:
| Metric | Before | After | Improvement |
|---|---|---|---|
| Comprehensive Energy | 19,200 tce | 16,400 tce | ↓ 14.6% |
| Electricity Consumption | 118M kWh | 104.1M kWh | ↓ 11.8% |
| Carbon Emissions | 50,800 tCO2 | 43,100 tCO2 | ↓ 15.2% |
| Annual Cost Savings | - | ~12.86 Million RMB | |
Economic Payback: With a total investment of ~31.2 million RMB, the static payback period is approximately 3.1 years. Management capabilities also shifted from monthly bill checking to real-time curve viewing and automated work orders.
Lessons Learned & Outlook
This case demonstrates that successful industrial park energy management requires a synergy of data, mechanisms, and operations. Key takeaways include:
- Metering is Foundation: Without accurate sub-metering, anomalies cannot be identified.
- Closed-Loop Control: Visualization alone is insufficient; optimization strategies must be executed on specific equipment.
- Organizational Mechanism: Integrating operators, property management, and tenants into a unified working system is crucial for data permissions and strategy approval.
Looking ahead, the park will expand into virtual power plants, microgrids, and carbon asset management. By leveraging true metering and continuous operation, industrial parks can achieve the synergy of energy conservation, cost reduction, and low-carbon development.