Waterlogging vs. Early Warning: A Selection Guide for Urban Pipe Network Scenarios
Introduction: Urban Waterlogging Warning Enters a Technology-Combination Phase
With extreme rainfall events becoming more frequent, the probability of water accumulation in urban roads, underpasses, low-lying communities, and underground parking garage entrances has risen markedly. Traditional flood-control work mainly relies on manual patrols, citizen repair reports, and duty monitoring; the information transmission chain is long, and flooding is often perceived only after it has already affected traffic, pedestrian safety, or underground space operations.
As urban safety governance advances, waterlogging warning is no longer merely "seeing water"; it requires judgment, issuance, and response before rainfall occurs, before waterlogging forms, and before risks escalate.
From a technical-route perspective, current urban waterlogging warning revolves around meteorological radar, video-surveillance AI recognition, water-level sensor IoT sensing, hydrological models, and multi-source fusion platforms. Each route addresses different levels of problems: radar focuses on rainfall sources, video on surface manifestations, sensors on node-specific quantitative risk, models on spatial prediction, and fusion platforms on closed-loop decision-making.
Industry practice shows that a single technology can hardly cover the entire process. Rainfall monitoring answers "whether water will come"; video recognition answers "where waterlogging has occurred"; water-level sensors answer "whether depth reaches risk thresholds"; model simulation answers "how waterlogging will evolve"; and multi-source fusion answers "who will respond and how to dispatch."
Meteorological Radar Route: "Upstream Capability" for Nowcasting
Meteorological radar is an important upstream sensing means, especially suitable for nowcasting heavy-rainfall forecasts. Commonly used urban radars include S-band (radius >200 km), C-band (100–150 km), and X-band (50–100 km). For urban scenarios, X-band radars are ideal for filling blind spots around cities and in mountainous areas. The core value lies in detecting heavy-rainfall centers in advance, gaining time for pump-station dispatch and road closures.
- Performance: Modern dual-polarization radars achieve volume scans every 5–6 minutes with spatial resolution of 500m–1km.
- Accuracy: Quantitative precipitation estimation errors are generally between 20% and 30%.
- Lead Time: Can provide 10–60 minutes lead time; some cities have raised this to 20–35 minutes for key low-lying sections using X-band networks.
However, the radar route has clear boundaries. It observes rainfall, not road waterlogging. Converting rainfall data to waterlogging predictions requires considering terrain, pipe networks, and drainage capacity. Additionally, high-rise buildings and interchanges can create detection blind spots. Therefore, radar is best suited as a basic capability for citywide rainfall warning rather than a standalone waterlogging system.
Video AI Route: "Intuitive Perception" for Road Recognition
Video surveillance combined with AI uses existing traffic checkpoints or newly built points to identify features like darkening pavement, mirror-like reflections, ripples, and vehicle wading. Compared to manual monitoring, AI can continuously analyze multiple locations during heavy rain, reducing duty pressure.
Key Metrics:
- Recognition accuracy: 85%–95% under good lighting.
- Classification: Slight (<10cm), Moderate (30cm), Severe (>50cm).
- Response time: Alerts output within 1–5 minutes.
Advantages include intuitive visualization, strong resource reuse, and short deployment cycles. However, performance is affected by nighttime, backlighting, tree shadows, and lens contamination. Algorithms may produce false alarms from complex reflections and cannot precisely measure depth without additional tools. Thus, Video AI is best used as a means of "seeing waterlogging" combined with sensors and models for quantitative warning.
Water-Level Sensors & IoT: "Quantitative Baseline" for Critical Nodes
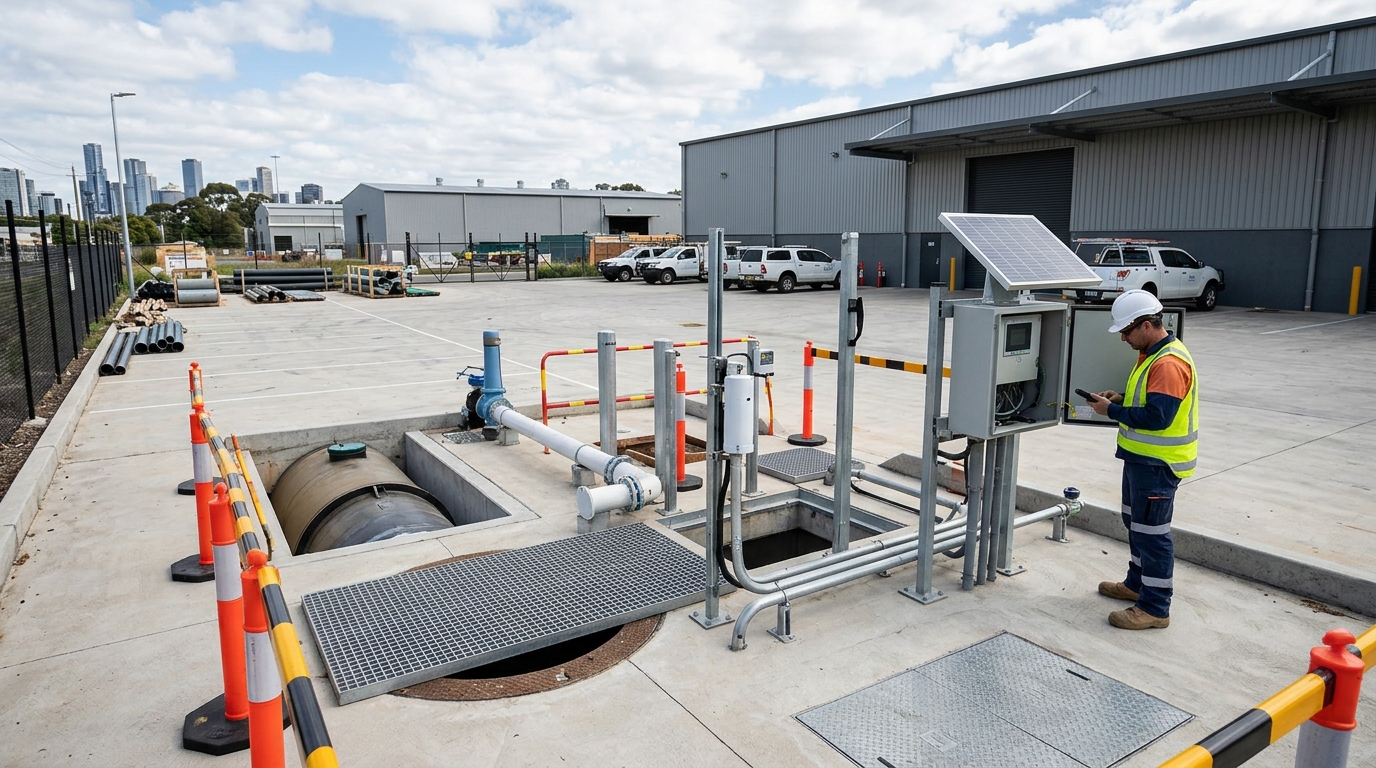
This is the most direct quantitative measurement method. Common devices include electronic, radar, pressure, ultrasonic, and laser water gauges. Radar gauges are non-contact and suitable for underpasses prone to debris; pressure gauges fit manholes and underground spaces. Their core value is answering "how deep is the water?" at key points.
| Threshold Level | Depth Reference | Action Trigger |
|---|---|---|
| Advisory | ~15 cm | Public Alert |
| Warning | ~30 cm | Vehicle Entry Prohibition |
| Severe Risk | ~50 cm | Closure & Emergency Drainage |
Accuracy typically ranges from ±1 to ±3 cm. While reliable and easy to link with flood-control actions, these are point-based devices. Installation requires careful consideration of elevation, slope, and siltation. Maintenance costs are significant due to exposure to harsh environments. For budget-constrained cities, prioritizing these sensors at high-risk nodes like subway entrances and underpasses is cost-effective.
Hydrological Models: From "Seeing" to "Predicting"
Tools like SWMM, InfoWorks ICM, and HEC-RAS simulate rainfall runoff, pipe-network convergence, and waterlogging evolution. Unlike sensors, models emphasize mechanistic calculations, answering questions such as "which areas will flood, how deep, and how long?"
- Data Requirements: High-resolution DEM, land use, pipe topology, and pump capacities.
- Grid Resolution: Typically 10–50 meters for urban areas.
- Calibration: Measured by Nash-Sutcliffe efficiency (NSE); good data yields NSE of 0.7–0.85.
Models offer spatial continuity and scenario simulation capabilities, useful for identifying potential risks and optimizing dispatch. However, they require high data-governance costs and are sensitive to real-time input errors. They must form a closed loop with sensing data and business rules rather than standing alone.
Multi-Source Fusion: Turning Warning into Decision Chains
Fusion platforms integrate radar trends, model predictions, video verification, and sensor confirmation through unified spatiotemporal references. The goal is not just "more data," but accurate judgment and actionable disposal.
Case Study: An eastern coastal city connected radar, 200 video channels, and 80 water-level sensors. During a heavy rain event (>50mm/h), the system generated heatmaps and automated dispatch suggestions, reducing average response time by ~30%.
Multi-source fusion can improve warning accuracy by 10–20 percentage points and reduce false alarms. However, construction difficulty is high due to inconsistent data interfaces and latency issues. Without field-response mechanisms, platforms risk becoming mere "large-screen displays." Priority should be given to high-frequency scenarios like underpass control and pump-station dispatch.
Selection Strategy: Cost Boundaries & Recommendations
Limited Budget Approach
- Identify high-risk points via historical review.
- Deploy water-level sensors and limited Video AI at critical nodes.
- Add radar/models later to improve lead time.
- Build fusion platform last for closed-loop management.
Megacity / Key Flood-Control City
- Simultaneous planning of radar blind-spot filling.
- Comprehensive Video AI and Sensor network.
- Advanced Hydrological Modeling.
- Full Platform Integration with O&M reserves.
Technology selection should start with a risk inventory, not a technology inventory. Review past waterlogging events to classify risks by depth, duration, and impact.
Indicator Design Tips
- Underpasses: Prioritize accuracy to avoid missed alarms causing vehicle entrapment.
- Roads: Increase sensitivity for advisories to facilitate citizen detours.
- Pump Stations: Focus on 30–60 minute rainfall trends and pipe-network changes.
Future trends indicate diversified sensing, lightweight edge-computing algorithms, and a shift from passive emergency response to proactive governance. Ultimately, effectiveness depends on whether data enters the business closed loop and transforms into actionable response measures.

