Comprehensive Guide to the Full Installation and Commissioning Process for Carbon Emission Monitoring (with FAQs)
Navigating the transition from annual accounting to continuous online monitoring in the era of "Dual Carbon" goals.
Against the backdrop of the "Dual Carbon" goals, the expansion of the national carbon market, and the gradual implementation of product carbon footprint rules, corporate management of greenhouse gas emissions is shifting from annual report-based carbon accounting to online monitoring that enables continuous data collection, traceability, and comparability.
Carbon emission monitoring is not simply about installing a carbon dioxide analyzer; it requires integrating metering instruments, sampling systems, data acquisition, accounting models, and O&M protocols into a complete data chain. This guide focuses on the practical aspects of carbon emission monitoring, outlining methods for installation, commissioning, routine maintenance, and common troubleshooting.
Key Performance Indicators
- Data Availability: No less than 95% for monthly emission data usability.
- Frequency: At least one valid record per hour for key parameters.
- Traceability: Fully documented calibration records.
- Scope: Includes CO₂, CH₄, and N₂O converted to CO₂ equivalent.
I. Defining Boundaries First: Technical Pathways for Carbon Accounting, Carbon Footprint, and Online Monitoring
Before implementing carbon emission monitoring, organizational and operational boundaries must be clearly defined. Organizational carbon inventories typically cover Scope 1, Scope 2, and Scope 3:
- Scope 1: Stationary combustion, mobile combustion, and industrial process emissions.
- Scope 2: Indirect emissions from purchased electricity and heat.
- Scope 3: Broader areas such as the supply chain, transportation, and product use.
In terms of technical pathways, there are three common methods:
- Emission Factor Method: Emissions = Activity Data × Emission Factor. (e.g., Natural gas consumption × 2.162 kg CO₂/m³).
- Mass Balance Method: Applicable to process emissions such as carbonate decomposition.
- Direct Monitoring Method: Continuous measurement of CO₂ concentration, flow rate, temperature, pressure, humidity, and oxygen content via online flue gas monitoring.
Case Study: An electronic manufacturing enterprise included reflow soldering machines and boilers in its boundaries. By prioritizing sub-metering for electricity and online CO₂ monitoring for the boiler, they reduced monthly data deviation from 12% to within 5%.
II. Pre-Installation Preparation: One-Time Confirmation of Measurement Points, Ranges, Sampling, and Data Calibers
Before installation, process parameters must first be collected: stack diameter, flue gas temperature, pressure, humidity, oxygen content, flow velocity range, pollutant composition, and corrosion characteristics. Range selection should avoid long-term operation above 90% of full scale.
Instrument Selection Guide
- CO₂: NDIR/Infrared (0–20% vol, Error ±1% FS)
- CH₄: Tunable Diode Laser (0–1000 ppm)
- O₂: Zirconia/Electrochemical (0–25%)
- Flow: Pitot/Ultrasonic/Thermal (0–30 m/s)
- Temp: Pt100 Sensors
Sampling System Specs
- Probe: Heated & Filtered
- Line Temp: Maintain 120°C–180°C
- Purpose: Prevent water vapor condensation & CO₂ dissolution
Data Calibers: Dry or wet basis? Standard or actual conditions? Reference oxygen content? If CH₄ and N₂O are involved, convert to CO₂ equivalent using 100-year GWP values of 28 and 265, respectively.
III. Installation Steps: On-Site Process from Sampling Port Drilling to Cloud Data Upload
Site Survey & Safety
Confirm work permits, boiler shutdown, cooling, pressure relief, and ventilation conditions.
Platform & Port Installation
Select stable airflow sections. Avoid elbows/valves. Ensure upstream straight pipe ≥2D and downstream ≥0.5D.
Sensor & Probe Placement
Insert probe to center/multi-point grid. Align flow meter direction. Ensure differential pressure ports are not reversed.
Sampling Lines
Short, straight, minimal bends (<70m). Slope ≥5° towards drainage. Continuous insulation for heated lines.
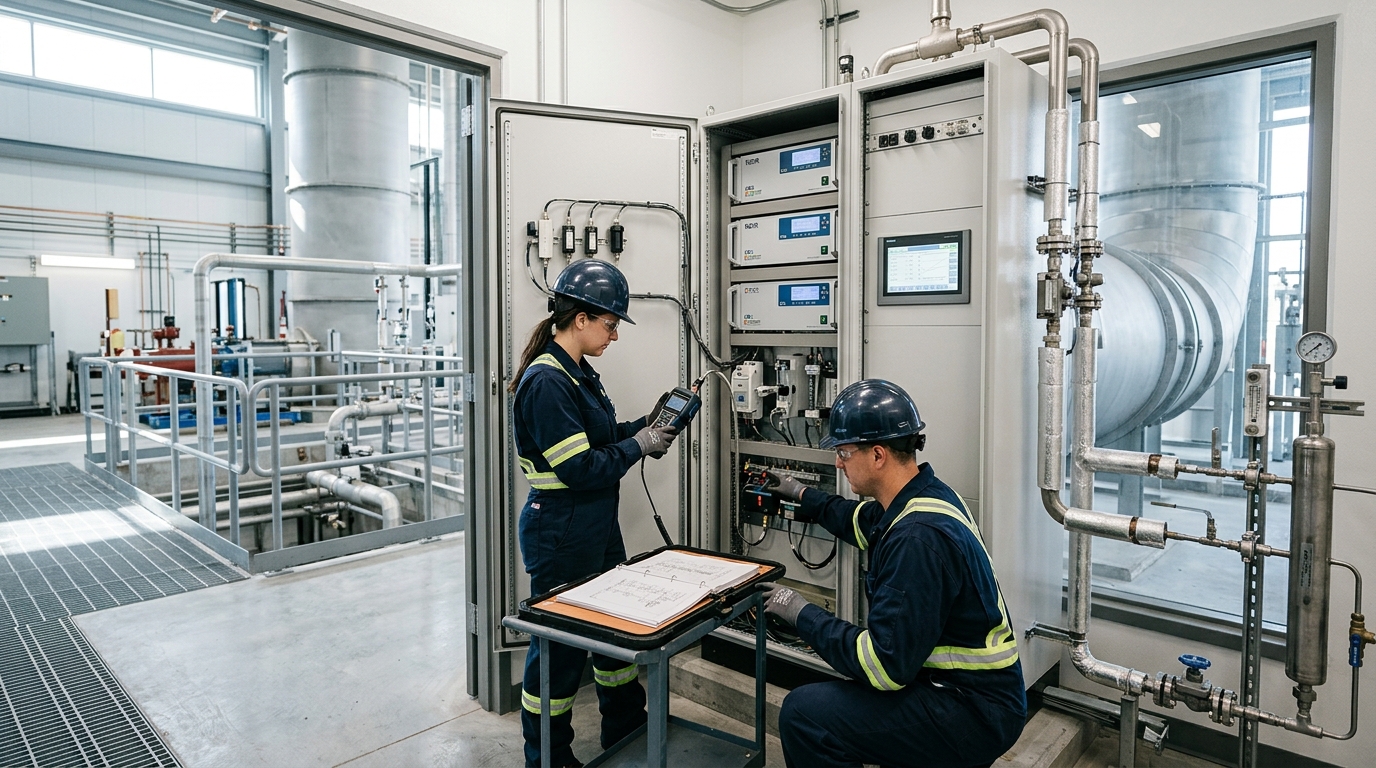
Pretreatment & Analyzer Cabinet
Rainproof/dustproof. Ambient temp 5°C–35°C. Condenser 2°C–5°C. UPS ≥30 mins. Grounding ≤4Ω.
Data Acquisition & Upload
Config stack number, fuel type, ranges. Sampling freq ≥1/min. Retain data ≥5 years. Use Modbus/4G/Ethernet.
IV. Commissioning Methods: Calibration, Cross-Checking, and Uncertainty Control
The commissioning process involves three critical phases to ensure data accuracy and reliability.
Phase 1: Standalone Equipment Inspection
- Warm-up: Confirm analyzer warm-up time (typically ≥30 mins).
- Airtightness Check: Observe flow rate changes under normal suction. If drop >5%, inspect joints/filters.
- Zero/Span Calibration: Use high-purity nitrogen/zero gas for zero point. Use standard gas near 80% FS for span.
Phase 2: Multi-point Calibration & Cross-Checking
For critical sources, perform multi-point calibration at 0%, 20%, 50%, and 80% span. Linear error should be controlled within ±2% FS. Flow velocity relative error ≤±10%; CO₂ concentration relative error ≤±5%.
Phase 3: Cross-Validation with Carbon Accounting
Compare cumulative online emissions with fuel consumption/emission factor results over one month. If deviation exceeds 10%, check fuel metering accuracy, calorific value, air leakage, and reference oxygen settings.
V. Routine Maintenance: Periodic Tasks to Ensure Long-Term Reliability
Maintenance Schedule Checklist
Check data availability (>45 min/hr), alarms, heating line temp, condenser temp, sampling flow, and drainage.
Inspect sampling filters, pump diaphragms, pipeline water accumulation, and standard gas pressure.
Check zero/span drift. CO₂ Zero drift ≤±2% FS; Span drift ≤±2.5% FS. Recalibrate if exceeded.
Quarterly & Annual: Conduct systematic calibration reviews. Arrange annual third-party verification. Note sensor lifespans: Electrochemical O₂ sensors (1–3 years) vs. Infrared CO₂ detectors (>5 years).
Maintenance records are crucial for carbon data quality. Include maintenance time, personnel, instrument ID, standard gas batch numbers, pre/post-calibration readings, and fault handling. Raw data must never be deleted; flag data during maintenance or faults.
VI. Common Troubleshooting: From Data Anomalies to Root Cause Resolution
Fault Type 1: Concentration Data at Zero/Negative
Cause: Pump shutdown, probe blockage, heating failure, or incorrect range.
Action: Check flow/pump current, back-purge probe, confirm standard gas valve closed, recalibrate zero.
Fault Type 2: Abnormally High Data or Fluctuation
Cause: Abnormal combustion, condenser failure, filter contamination, or unstable fan regulation.
Action: Simultaneously check O₂ and Flow. If CO₂ rises while O₂ drops → Combustion change. If CO₂ rises & O₂ high → Air leakage.
Fault Type 3: Abnormal Flow/Communication Interruption
Cause: Pitot tube blockage, DP transmitter zero shift, RS485 address conflicts, or weak 4G signal.
Action: Check local data, SIM card/antenna/IP, and Modbus point table. Verify dry/wet basis and GWP settings.
VII. Concluding Outlook: Moving from Compliance Monitoring to Carbon Asset Data Infrastructure
The value of carbon emission monitoring extends beyond merely coping with verifications or filling out reports. As carbon markets, green supply chains, product carbon footprint labeling, and ESG disclosure requirements become increasingly detailed, enterprises need to transform online monitoring data into auditable, reusable carbon asset data that supports business decisions.
Future trends include expanding monitoring targets to CH₄ and N₂O, shifting data granularity to minute-level/batch-level, and standardizing interfaces between monitoring, accounting, and trading systems. Enterprises should continuously improve by including key sources in online monitoring, establishing metering ledgers, embedding accounting rules into data acquisition, and regularly conducting uncertainty assessments.