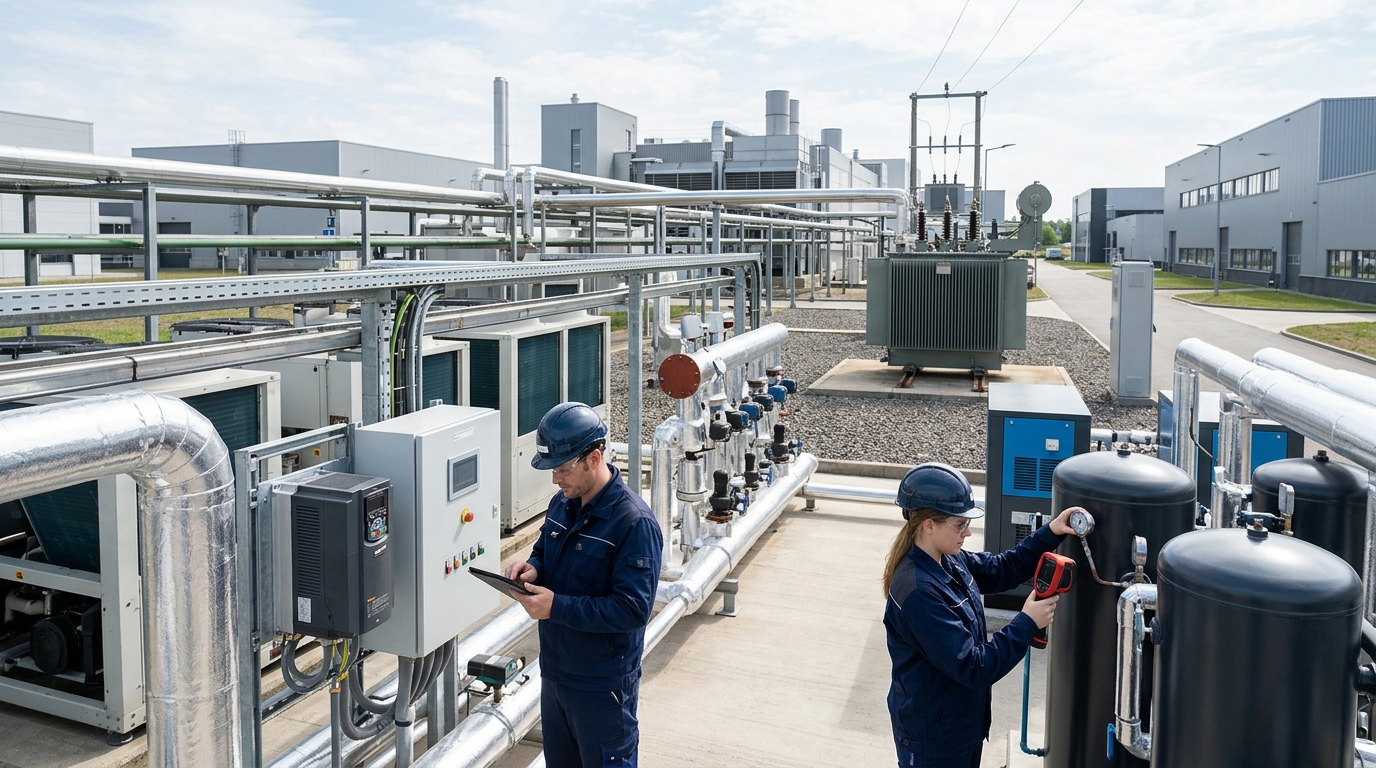
In-Depth Comparison of Four Carbon Emission Monitoring Technology Pathways
[Ecolor Technology Industry Observation Room / In-depth Report]
In the grand historical process of addressing climate change and advancing the "dual carbon" goals (carbon peaking and carbon neutrality), the accuracy, real-time availability, and traceability of greenhouse gas emission data have become core cornerstones for measuring countries' emission reduction performance and maintaining fairness in global carbon market transactions. As an observer deeply rooted at the forefront of the technology and environmental protection industries, the Ecolor Technology News Editorial Office has noted that with the implementation of international carbon border adjustment mechanisms (such as the EU CBAM) and the expansion of China's national carbon emissions trading market, enterprises are no longer facing merely macro policy advocacy, but tangible carbon cost accountability.
Against this backdrop, accurately quantifying greenhouse gas emissions has become a major technical challenge jointly facing industry and the technology sector. For a long time, "carbon accounting" methods based on mass balance have dominated. However, with rapid advances in IoT, optical sensing, and spectroscopic analysis, "online monitoring" technologies are entering carbon emission management systems at unprecedented speed. This article provides an in-depth analysis of mainstream carbon emission monitoring technology routes, objectively compares their physical principles, advantages, disadvantages, and applicable scenarios, and, combined with cutting-edge applications such as carbon accounting and carbon footprint tracking, offers professional and objective strategic references for technology selection and digital transformation of energy-intensive enterprises.
1. The Era Context of Carbon Emission Monitoring: Core Drivers from "Rough Estimation" to "Precision Measurement"
Accurate measurement of greenhouse gases is a prerequisite for global climate governance. Currently, major global economies are accelerating the construction of data-driven carbon management systems. Traditionally, enterprises often relied on annual or quarterly carbon accounting reports; this lagging data feedback mechanism can no longer meet the needs of modern carbon asset management.
First, the rigid demand for policy compliance and carbon market trading is a core driver. Taking China's national carbon market as an example, in 2023 cumulative carbon emission allowance trading volume reached 212 million tonnes, with transaction value exceeding RMB 14.4 billion. Under such a massive trading scale, even a 1% data error could lead to financial deviations of tens of millions to over a hundred million yuan. The quality of carbon emission data directly determines the credibility and liquidity of the carbon market.
Second, global supply chains are imposing increasingly stringent transparency requirements on "carbon footprints." As multinational enterprises successively propose Scope 3 emission reduction targets, full life-cycle (LCA) carbon footprint tracking has become a mandatory course. From upstream raw material extraction and midstream manufacturing to downstream logistics, carbon emissions at every stage need to be precisely recorded. Traditional accounting methods based on industry-average emission factors cannot reflect individual enterprises' efforts in energy-saving technical upgrades, nor can they create differentiated competitive advantages in international trade. Therefore, introducing high-frequency, high-precision online greenhouse gas monitoring systems to achieve the leap from "estimation" to "measured data" has become an inevitable trend for industrial upgrading.
2. Evolution and Technological Contest between Traditional "Carbon Accounting" and Modern "Online Monitoring"
Before discussing specific hardware technologies, we must clarify the two core methodologies currently used for greenhouse gas quantification: the emission factor method (carbon accounting) and continuous emissions monitoring systems (CEMS, i.e., online monitoring). At the current stage, the two are not entirely substitutive but involve a contest and integration process of mutual complementation and cross-validation.
1. Traditional Carbon Accounting
Carbon accounting is currently the internationally mainstream method and is widely recognized by the IPCC (Intergovernmental Panel on Climate Change). Its core logic is: greenhouse gas emissions = activity data (e.g., coal consumption) × emission factor (CO2 generated by burning one unit of coal).
Advantages: low implementation cost, mature theoretical framework, and suitability for macro national-level accounting and small and medium-sized enterprises lacking monitoring instruments.
Disadvantages: relatively high uncertainty. Taking coal-fired power plants as an example, coal source, batch, carbon content, and oxidation rate fluctuate greatly during actual combustion. If only default emission factors are used, the error rate may reach 10% to 20% under certain extreme operating conditions. In addition, carbon accounting is a "post-event settlement" and cannot provide real-time data support for dynamic energy-saving optimization during production.
2. Modern Online Monitoring (CEMS)
Continuous Emissions Monitoring Systems (CEMS) directly install gas sampling and analysis instruments in flues or emission outlets to measure the concentrations of greenhouse gases such as carbon dioxide (CO2), methane (CH4), and nitrous oxide (N2O) in flue gas in real time, and combine parameters such as flue gas velocity, temperature, and pressure to directly calculate absolute emissions.
Advantages: extremely strong data real-time capability (typically second- or minute-level response), capable of truly reflecting dynamic emission characteristics of enterprises under different operating conditions and loads, providing "live data" for carbon asset management and production process optimization.
Disadvantages: high initial equipment procurement cost (CAPEX) and later operation and maintenance cost (OPEX); in harsh flue gas environments with high temperature, high humidity, and high dust, instrument drift, wear, and standard gas calibration impose extremely high requirements on data quality control.
3. In-depth Analysis of Mainstream Continuous Online Carbon Emission Monitoring Technology Routes
The core of online monitoring lies in the sensing technology of gas analysis instruments. Currently, for online monitoring of greenhouse gases from fixed pollution sources, the industry mainly adopts optical and spectroscopic technologies. The Ecolor Technology News Editorial Office has reviewed the four most widely applied technology routes in the current market and objectively compared their technical parameters, advantages, and disadvantages.
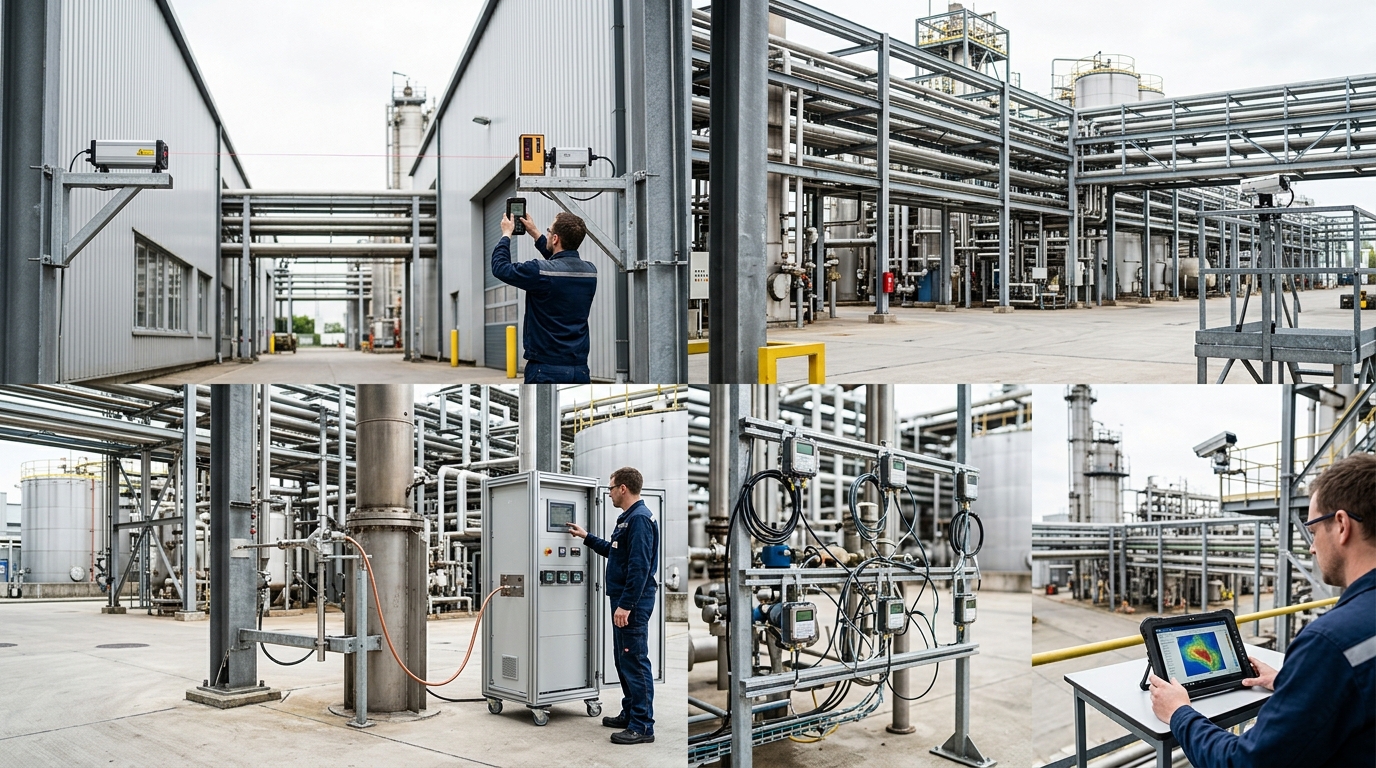
1. Non-Dispersive Infrared Absorption Spectroscopy (NDIR)
Technical principle: NDIR is based on the selective absorption of specific infrared wavelengths by gas molecules. For example, CO2 has a strong absorption peak at a wavelength of 4.26 micrometers. Broadband infrared light emitted by a light source passes through a gas cell containing the sample gas; light at specific wavelengths is absorbed by the target gas, and the detector measures the attenuation of light intensity to calculate gas concentration according to the Beer-Lambert Law.
Core advantages: extremely mature technology, relatively simple structure, low manufacturing cost, and high cost-effectiveness. It has a wide measurement range, meeting requirements from hundreds of ppm to percentage levels (such as CO2 concentrations of 10%–15% in flue gas).
Technical limitations: susceptible to cross-interference from background gases (such as water vapor H2O and carbon monoxide CO); aging of optical components and gas cell contamination can easily cause zero drift, requiring regular calibration with standard gases; measurement accuracy is typically between ±1% and ±2% F.S. (full scale), with limited capability for monitoring very low greenhouse gas concentrations.
2. Fourier Transform Infrared Spectroscopy (FTIR)
Technical principle: FTIR uses a Michelson interferometer to generate interference light. After passing through the sample gas, the detector receives an interferogram, and a computer performs Fast Fourier Transform (FFT) mathematical processing to reconstruct a broadband infrared absorption spectrum.
Core advantages: "full-spectrum" analysis capability is its greatest highlight. A single FTIR instrument can simultaneously monitor CO2, CH4, N2O, SO2, NOx, HCl, and dozens of other gas components, with high spectral resolution (typically up to 0.5 cm⁻¹). It can effectively remove cross-interference from water vapor and other complex background gases through algorithms. For enterprises needing to monitor both conventional pollutants and greenhouse gases, this is an ideal "multi-purpose in one" solution.
Technical limitations: equipment structure is precise and complex, sensitive to vibration and temperature; procurement cost is high (usually several times that of NDIR); real-time processing of massive spectral data imposes high requirements on computing hardware; in extremely high dust environments, maintenance costs of optical components such as mirrors are high.
3. Tunable Diode Laser Absorption Spectroscopy (TDLAS)
Technical principle: TDLAS uses a wavelength-tunable, narrow-linewidth semiconductor laser as the light source. By modulating the laser's temperature and current, the emitted wavelength precisely scans a single absorption line of the target gas.
Core advantages: extremely high monochromaticity and selectivity, fundamentally eliminating cross-interference from other gases based on physical principles. It has extremely fast response speed (millisecond to second level) and high measurement accuracy (typically less than ±1% F.S.). More importantly, TDLAS can be installed in situ, i.e., laser transmitter and receiver are mounted facing each other on opposite sides of a flue, without complex sampling and preprocessing systems, making it highly suitable for harsh conditions with high temperature, high pressure, and high dust.
Technical limitations: because single-line absorption is used, one laser typically measures only one or two specific gases; simultaneous monitoring of CO2 and CH4 may require a dual-laser configuration, increasing cost. In-situ installation may be affected by representativeness when flue diameter is too large or flue gas flow field is extremely uneven.
4. Cavity Ring-down Spectroscopy (CRDS)
Technical principle: CRDS introduces laser light into an optical resonator composed of high-reflectivity mirrors. The laser reflects multiple times inside the cavity, achieving an effective optical path length of several kilometers or even tens of kilometers. After the light source is cut off, light intensity decays exponentially over time; gas concentration is calculated by measuring minute changes in the "ring-down time."
Core advantages: extremely high sensitivity, capable of ultra-high-precision measurement at ppb (parts per billion) or even ppt (parts per trillion) levels. It holds a dominant position in greenhouse gas background monitoring (e.g., atmospheric background stations).
Technical limitations: equipment is extremely expensive and delicate, requiring very high sample gas cleanliness (no particulate contamination of high-reflectivity mirrors). Therefore, CRDS is mainly used for atmospheric environmental greenhouse gas monitoring or research-grade high-precision isotope analysis, and is generally not suitable for direct emission monitoring in high-concentration, dirty industrial stack conditions.
4. Spatial and Remote Sensing Technologies: Macro and Stereoscopic Perspectives for Greenhouse Gas Monitoring
While focusing on point-source emissions from industrial stacks and similar facilities, the technology landscape of greenhouse gas monitoring is expanding toward spatial and stereoscopic dimensions. To comprehensively grasp regional and global carbon budgets, building an "integrated space-air-ground" monitoring network has become an international consensus.
1. Satellite Remote Sensing Monitoring
Satellite remote sensing is the ultimate tool for assessing global greenhouse gas distribution and validating national-level carbon accounting inventories. For example, the United States' OCO-2/3 satellites, Japan's GOSAT, and China's "TanSat" carbon satellite and Fengyun series meteorological satellites all carry high-resolution hyperspectral greenhouse gas detectors. They measure the spectral characteristics of sunlight passing through Earth's atmosphere and reflected back to space, retrieving CO2 and CH4 concentrations in the atmospheric column.
Current satellite monitoring accuracy has reached the 1–2 ppm (parts per million) level, and spatial resolution is advancing toward 2 km × 2 km or better. The introduction of satellite data makes cross-border carbon emission tracking possible and provides massive measured data for refining macro climate models.
2. UAV and Airborne LiDAR Technologies
At medium scales such as industrial parks or oil and gas fields, UAVs equipped with LiDAR or miniature gas sniffing sensors play an irreplaceable role. Especially for fugitive emissions in the petrochemical industry (such as methane leakage from natural gas pipelines and volatilization from tank farms), UAVs can perform 3D gridded patrol flights.
Combined with gas dispersion models (such as the Gaussian plume model), UAVs can not only "discover" leak points but also quantitatively retrieve leak rates. This flexible monitoring method greatly fills the blind spots of fixed online monitoring and traditional manual inspections, and is a key technical means for controlling the escape of high-potency greenhouse gases (methane's greenhouse effect is more than 20 times that of CO2).
5. Applicable Scenarios and Technology Selection Guide for Typical Energy-Intensive Industries
Discussing technology routes without reference to actual business scenarios is meaningless. Different industrial sectors have huge differences in flue gas characteristics, emission scale, and compliance requirements. Based on industry practice, the Ecolor Technology News Editorial Office has compiled technology selection recommendations for the following four typical energy-intensive industries.
1. Thermal Power Generation Industry
Scenario characteristics: enormous emissions (accounting for a relatively high proportion of national total emissions), fast flue gas velocity, and CO2 concentration typically between 10% and 15%. After desulfurization, denitrification, and dust removal, the flue gas temperature is moderate but humidity is relatively high.
Selection recommendation: Thermal power plants are currently the area with the highest concentration of CEMS pilot projects for continuous carbon emission monitoring. Considering both data stability and economic efficiency, high-precision NDIR technology combined with a comprehensive cold-dry sampling preprocessing system is currently the most cost-effective first choice. If an enterprise has extremely high requirements for real-time data response and maintenance-free operation, and has sufficient budget, in-situ TDLAS technology can be selected.
2. Steel and Metallurgy Industry
Scenario characteristics: long process flows (sintering, ironmaking, steelmaking, etc.) and extremely complex exhaust gas composition. Besides high-concentration CO2, there are large amounts of carbon monoxide (CO), sulfur dioxide (SO2), and high dust concentrations, causing severe cross-interference from background gases.
Selection recommendation: Strongly recommend FTIR (Fourier Transform Infrared Spectroscopy) technology. Steel enterprises usually need to simultaneously monitor conventional environmental indicators (SO2, NOx) and energy indicators (CO). FTIR's multi-component simultaneous measurement capability and strong anti-cross-interference algorithms can maximize equipment return on investment. In terms of sampling, high-temperature heated sample lines and multi-stage precision filtration systems must be installed to cope with high dust challenges.
3. Cement and Building Materials Industry
Scenario characteristics: cement kiln tail flue gas has high temperature and extremely high dust concentration. Due to limestone (calcium carbonate) decomposition, CO2 concentration is extremely high (can reach 20%–30%).
Selection recommendation: High-temperature and high-dust environments pose severe challenges to any sampling preprocessing system. It is recommended to use high-temperature extractive NDIR or TDLAS technology. Especially for TDLAS, if lens purge and dust protection issues can be resolved, its in-situ measurement method can effectively avoid the pain point of sampling line blockage. Meanwhile, for high-concentration CO2, short-path gas cells should be specially customized to prevent signal saturation.
4. Petrochemical and Natural Gas Extraction
Scenario characteristics: Besides CO2 emissions from combustion sources, the pain point in the petrochemical industry lies in widespread methane (CH4) fugitive emissions. Scenarios are widely distributed, and explosion-proof requirements are extremely high.
Selection recommendation: For fixed stacks, NDIR or TDLAS can be used. For fugitive emissions within the plant, it is recommended to build a "stereoscopic monitoring network": deploy fixed monitoring stations based on TDLAS or open-path laser around the plant boundary, and regularly use explosion-proof UAVs equipped with miniature laser sensors or OGI (Optical Gas Imaging) infrared thermal imagers inside the plant for leak detection and repair (LDAR) operations.
6. Carbon Footprint Tracking and Data Quality Control: Deep Challenges in Online Monitoring
Obtaining data is only the first step. Ensuring that data are true, accurate, and tamper-proof, and seamlessly integrating them into product carbon footprint evaluation systems, are the deep-water challenges faced by carbon emission monitoring.
1. Online Monitoring Empowering Full Life Cycle Carbon Footprint (LCA)
Traditional product carbon footprint calculations rely heavily on static life cycle databases (such as Ecoinvent). The introduction of online monitoring technologies makes dynamic, real-time carbon footprint accounting possible. For example, when a new energy vehicle manufacturer purchases "green steel," it can directly trace back through blockchain technology to the real-time direct emission data transmitted by the CEMS at the steel plant's stack for a specific batch of steel production, as well as the corresponding green electricity consumption ratio. Such carbon footprints based on primary data have far higher confidence than estimates based on industry averages and are a powerful tool for enterprises to break through international green trade barriers (such as the EU Battery Regulation).
2. Data Quality Assurance and Quality Control (QA/QC)
The "drift" of online monitoring instruments is dictated by physical characteristics and cannot be absolutely avoided. Therefore, a strict QA/QC system is the lifeline of data availability.
- Standard gas traceability: standard gases used for calibration must have traceability to national metrology institutions, and their concentration uncertainty should be controlled within 1%.
- Routine comparison: zero and span drift checks must be performed regularly (e.g., every 24 hours), and when deviations exceed the range permitted by regulations (e.g., ±2.5%), timely system calibration and data revision must be carried out.
- Coordinated measurement of flow rate and moisture: total carbon emissions = CO2 concentration × flue gas flow rate. In practice, errors in flue gas velocity measurement (Pitot tube or ultrasonic flow meter) and flue gas humidity measurement are often greater than errors in gas concentration measurement. Therefore, improving flow meter accuracy and multi-point gridded measurement technologies is key to improving the quality of final total carbon emission data.
3. Anti-tampering and Data Security Mechanisms
In the face of huge economic interests, preventing carbon data falsification is a top priority for regulators. Modern carbon emission monitoring systems must achieve hardware-level data encryption at the edge computing gateway. By introducing blockchain technology, raw data for each record—such as timestamped concentration, flow rate, and equipment operating status (e.g., enclosure door opening records and parameter modification records)—are directly put on chain, achieving end-to-end tamper resistance. Once an abnormal data interruption or human intervention occurs, the system automatically triggers an alert to the regulatory platform.
7. Industry Standard System Development and Outlook on Future Technology Integration Trends
The development of carbon emission monitoring technology cannot proceed without the support of a standard system and cross-disciplinary integration with frontier technologies.
1. Unification of Standard Systems and International Mutual Recognition
Currently, China has densely introduced a number of technical specifications for automatic greenhouse gas monitoring in industries such as thermal power and steel (e.g., HJ and related local standards). However, from a global perspective, the data cross-validation and mutual recognition mechanism between carbon accounting systems and online monitoring systems has not been fully established. In the future, establishing an online monitoring data acceptance standard that can seamlessly interface with ISO 14064 (Greenhouse Gas Verification Standard) and ISO 14067 (Carbon Footprint Standard), and achieving international mutual recognition, is an urgent issue for the industry.
2. Predictive Emission Monitoring Systems (PEMS) and AI Large Models
Relying solely on hardware monitoring has shortcomings such as high cost and vulnerability to faults. In the future, predictive emission monitoring systems (PEMS) based on artificial intelligence and machine learning will become an important complement. PEMS collects massive DCS (Distributed Control System) operating parameters such as boiler temperature, pressure, fuel consumption, and air volume, uses deep neural networks to establish nonlinear models, and calculates greenhouse gas emissions in real time through "soft measurement." PEMS and hardware CEMS can cross-validate each other, not only greatly improving data reliability but also providing legally acceptable data imputation when hardware faults occur.
3. Sensor Miniaturization and Low Cost
With the development of MEMS (Micro-Electro-Mechanical Systems) and silicon photonics, infrared and laser sensors are evolving toward chip-level integration, miniaturization, and low power consumption. In the future, carbon emission monitoring will no longer be limited to large stacks; like today's temperature and humidity sensors, they can be widely deployed at extremely low cost in workshops, buildings, transportation vehicles, and even smart homes, truly building an all-encompassing societal carbon emission IoT.
Conclusion
The transition of greenhouse gas emission monitoring from traditional "paper accounting" to hard-core "online measurement" is not only an upgrade of environmental regulatory means but also a reconstruction of the underlying infrastructure for global industry's digital and low-carbon transformation. NDIR's cost-effectiveness, FTIR's comprehensive precision, TDLAS's in-situ anti-interference, and remote sensing's macro overview together depict a stereoscopic, multi-dimensional carbon monitoring technology map.
As industry observers, the Ecolor Technology News Editorial Office believes that no single technology can cover all scenarios. When selecting technology, enterprises must base themselves on their own process characteristics, compliance requirements, and cost budgets to find the most suitable solution. At the same time, hardware sensors are only the starting point; how to use high-quality real-time monitoring data to close the loop among carbon accounting, carbon footprint tracking, and carbon asset trading, thereby driving energy-saving and carbon-reduction in production processes, is the key.