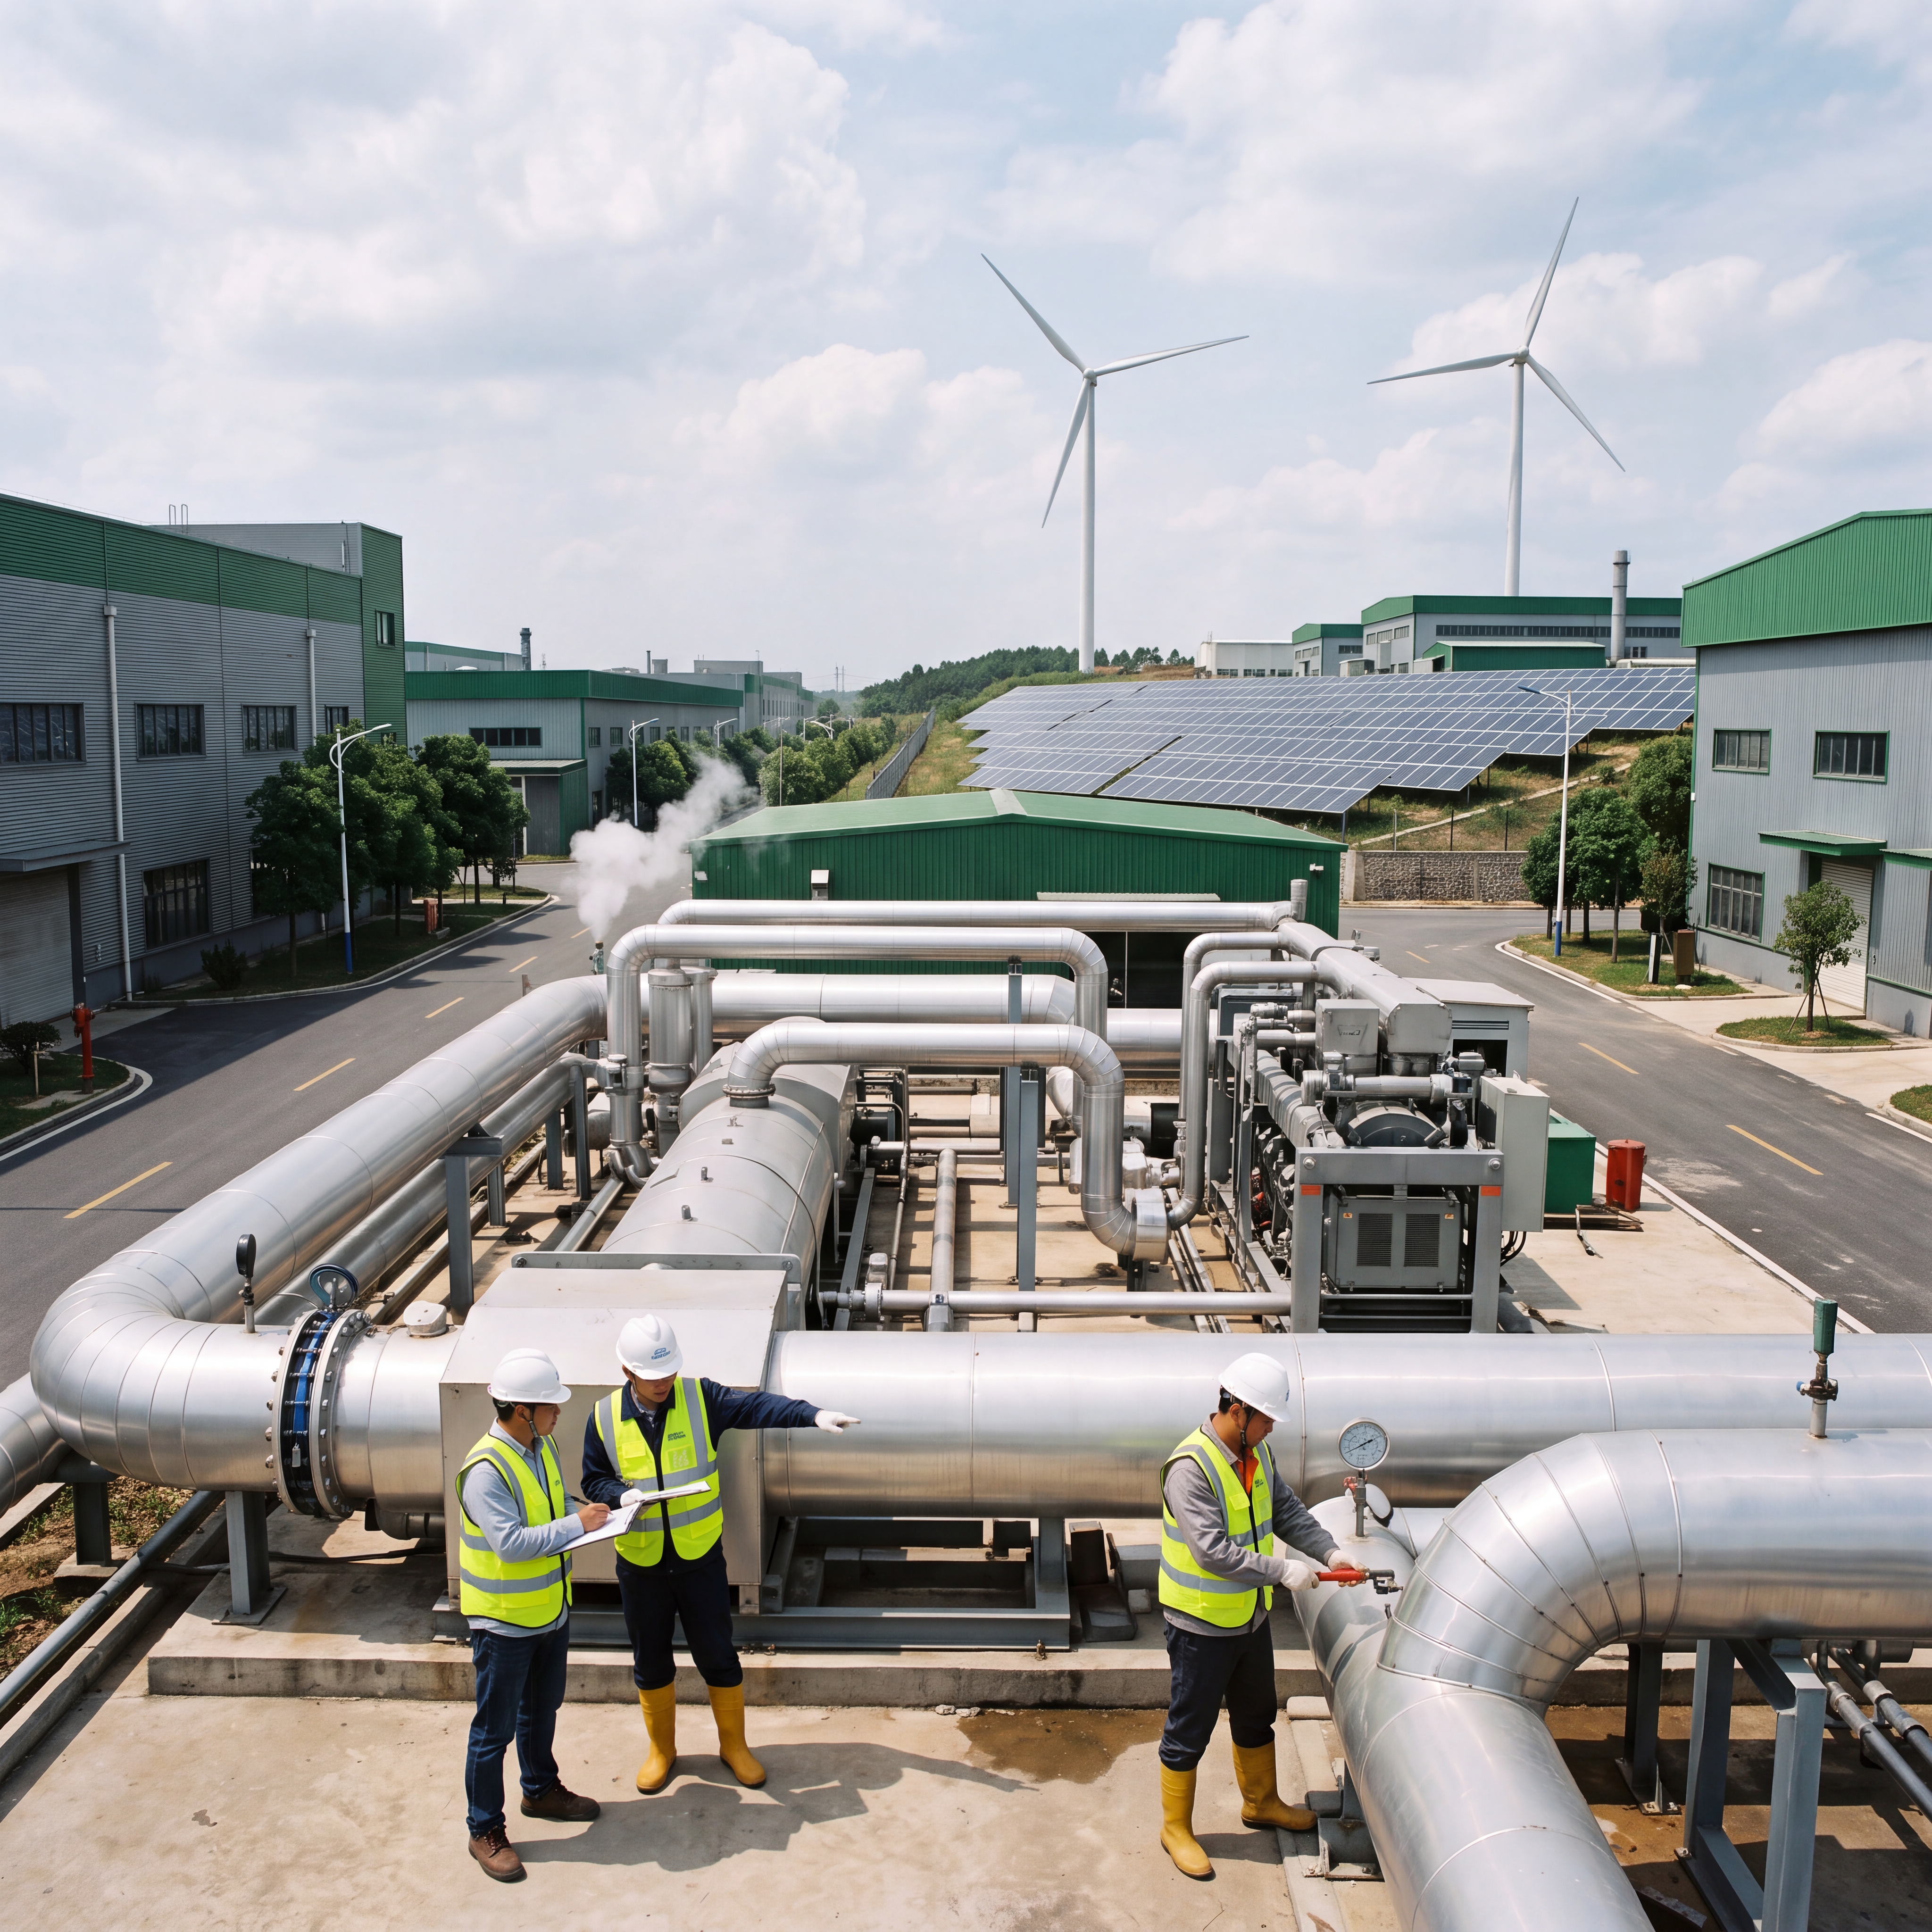
Carbon-Neutral Water Utilities: Measuring Industrial Footprints at the Source
Water is no longer just a utility—it’s the most granular, real-time carbon ledger in industrial operations. As China enforces SL651-2022 compliance and mandates carbon accounting for Tier-2+ manufacturers, flow, level, and energy data from water systems are now primary inputs for industrial carbon footprint verification.
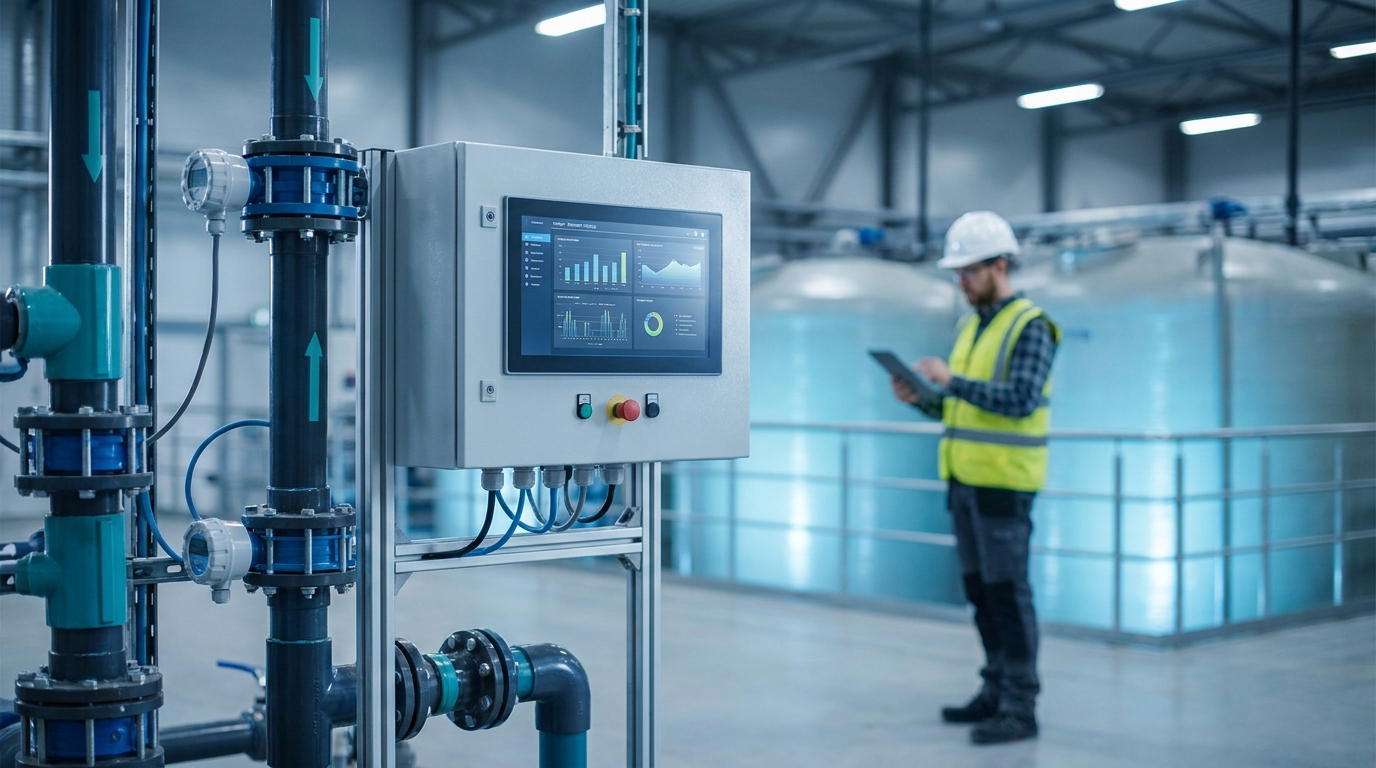
The Hidden Carbon Ledger in Every Pipe
A 2023 Ministry of Ecology and Environment (MEE) audit revealed that 42% of reported Scope 1 & 2 emissions from medium-sized manufacturing parks were misattributed due to uncalibrated water-energy interdependencies.
Cooling tower makeup, boiler feed, and wastewater lift all require electricity or steam. Without precise, time-synchronized volumetric and energy data, carbon reporting remains an estimate—not evidence.
That’s why forward-looking procurement managers are shifting from “flow accuracy” to “carbon traceability” as their core KPI.
Why Water Data Is Now the First Milestone in Carbon Neutrality
China’s Green Low-Carbon Industrial Park Pilot Program—now active in 12 provinces—requires participating zones to achieve ≥30% absolute carbon intensity reduction by 2027 (NDRC Notice No. 128, 2023).
Crucially, the program accepts only metered, tamper-proof, time-stamped water and energy data for verification. Legacy meters with ±2.5% uncertainty and no digital audit trail fall short.
Modern instrumentation must deliver sub-1% repeatability, secure edge logging, and seamless integration with carbon accounting platforms like China’s National Carbon Emission Registration System (NCERS).
“We used to calculate steam consumption via boiler fuel logs. Now we correlate LGF flow + HERO V9 power telemetry—and our carbon report passed third-party verification on first submission.”
— Plant Engineer, Zhejiang Automotive Components Park (Q3 2024)
The Triad of Carbon-Traceable Instrumentation
Three instrument classes form the operational backbone of verifiable carbon monitoring: volumetric flow (for water-based thermal/chemical processes), level (for storage, overflow, and runoff quantification), and energy telemetry (for pump, blower, and treatment system load attribution). Their synergy closes the loop between physical water movement and its embedded carbon cost.
LGF Electromagnetic Flowmeter
PA66 Bio-Based Housing
- • 63% lower embodied carbon vs. stainless steel (EPD verified)
- • ±0.3% reading accuracy, IP68, -20°C–70°C operation
- • Direct NCERS-compliant output: pulse/analog/Modbus
Visual Fusion Radar Level Sensor
80 GHz + HD Camera
- • ±1 mm precision + AI-verified visual confirmation
- • Eliminates false alarms from foam, vapor, debris
- • Enables stormwater runoff quantification per GB/T 32150-2015
HERO V9 RTU
Energy-Aware Remote Terminal Unit
- • Dual-channel kWh metering (Class 0.5S)
- • Built-in SL651-2022 protocol stack
- • Real-time kgCO₂e/m³ metrics using grid carbon intensity APIs
From Compliance to Competitive Advantage
Early adopters aren’t just avoiding penalties—they’re unlocking value. A textile park in Shaoxing reduced its annual carbon tax liability by ¥1.28 million after deploying LGF+HERO V9 across dyeing lines.
A food processing cluster in Guangdong qualified for ¥4.7M in green bond financing after demonstrating continuous, auditable water-energy-carbon correlation for 18 months.
- ✓ LGF + HERO V9 = automated Scope 2 attribution per production batch
- ✓ Visual fusion radar timestamps + cloud video = SL651-2022 evidentiary chain
- ✓ Unified firmware architecture = OTA updates for new MEE protocols
Beyond Sensors: The Integration Imperative
Hardware alone doesn’t close the carbon loop. What differentiates Ecolor Technology’s ecosystem is vertical integration: SITUMAN manufactures sensors to ISO 5167 and IEC 62053-21 standards; HuaYu ZhongNeng engineers turn raw telemetry into NCERS-ready XML reports, carbon dashboards, and automated audit packages.
Before Integration vs. After Ecolor Stack
Before Integration
- • 4–7 vendors per site
- • Manual CSV reconciliation
- • 22% average data latency (>15 min)
- • Zero SL651-2022 native support
After Ecolor Stack
- • Single-source accountability
- • Sub-second timestamp sync
- • Real-time SL651-2022 packet generation
- • Automated monthly NCERS export
The Next Threshold: From Measurement to Mitigation
The next frontier isn’t just measuring carbon—it’s prescribing action. Ecolor’s R&D team has embedded predictive analytics into the HERO V9 firmware.
Using historical LGF flow patterns and visual fusion radar trends, the system now flags anomalous water-energy ratios before they trigger carbon overruns.
Pilots in Jiangsu show a 37% reduction in unplanned high-carbon events (e.g., pump cavitation, cooling tower drift loss) within 90 days of deployment.
See What You Measure
For procurement managers evaluating carbon monitoring readiness, the question is no longer “Do we need better meters?” but “Does our instrumentation generate legally defensible, platform-ready carbon intelligence?”
With LGF, HERO V9, and visual fusion radar—engineered for durability, interoperability, and regulatory alignment—Ecolor Technology delivers the first true carbon-native instrumentation stack for water utilities and industrial parks.
Request a Carbon Traceability Assessment