Digital Transformation of Urban Pipe Networks: Data Silos and IoT Platforms
Urban pipe networks are lifeline systems supporting the operation of water supply, drainage, energy, and transportation. Among them, the leakage rate of water supply pipe networks has evolved in recent years from a single operational metric into an important yardstick for measuring urban governance, resource conservation, and infrastructure resilience. With ongoing urban renewal, water-saving city construction, underground pipe network renovation, and digital operations, leakage control is shifting from "post-burst emergency repair" to "pre-leakage early warning" and from experience-driven to data-driven approaches. Industry observations indicate that over the next three to five years, urban pipe network management will form a closed loop around zoning, metering, pressure, detection, repair, and operations. Leakage rate control will also become a key lever for water utilities to reduce costs, improve efficiency, safeguard water quality, and enhance public service capabilities.
I. Leakage Rate Upgraded from a Water Supply Indicator to an Urban Governance Indicator
In the past, the leakage rate of urban water supply pipe networks was mainly understood as an internal non-revenue water control metric for water utilities, primarily related to water balance, meter reading errors, and pipe network repair efficiency. Today, the meaning of leakage rate is expanding. It reflects not only actual physical leakage, but also metering errors, after-meter leakage, unauthorized water use, pressure fluctuations, losses from burst repairs, and hidden risks caused by aging pipe materials. The leakage rate is no longer merely "how much water is lost," but a comprehensive expression of urban infrastructure health, water supply safety redundancy, energy consumption levels, and green and low-carbon operation capability.
From a resource perspective, per capita water resources in many Chinese cities are below the internationally recognized warning line, and water supply systems have long been under high-intensity development pressure. Each one-percentage-point reduction in pipe network leakage means considerable water savings for a city, reducing chemical, electricity, and labor consumption in water abstraction, treatment, and distribution. From a resilience perspective, cities with high leakage rates often experience increased burst frequency, unstable water pressure, rising risks of secondary water quality contamination, and broader social impacts from sudden water outages. Therefore, leakage rate control is being elevated from a specialized task for water utilities to an important indicator in urban physical examinations, water-saving assessments, and infrastructure renewal.
Policy targets indicate that by 2025, the leakage rate of national urban public water supply pipe networks should be controlled within 9%, with some cities aiming for 7%. This drives the shift from "usable" to "precision-managed."
Policy levels have also provided clear direction. Targets proposed by the Ministry of Housing and Urban-Rural Development and other departments indicate that by 2025, the leakage rate of national urban public water supply pipe networks should be controlled within 9%, with some cities with better foundations aiming for 7%; county-level cities and established towns are generally required to keep it within 10%. This indicator is not merely a numerical constraint, but a driving condition for moving urban pipe networks from "usable" to "precision-managed." Urban water supply systems need to create synergy among pipe network surveys, district metering, pressure management, leakage detection, repair priorities, and long-term renewal plans to truly bring leakage rates down from high levels and maintain stability at lower levels.
II. Market Trends: Overlay of Stock Renewal and Digital Operations
The urban pipe network market is shifting from new construction expansion to stock governance. Over the past two decades, water supply scale in many cities grew rapidly, with pipe network length expanding from thousands of kilometers to tens or even hundreds of thousands of kilometers. However, early construction standards, pipe material selection, jointing techniques, and operation and maintenance data were not well developed. As pipe networks enter their aging cycle, problems such as leakage, bursts, water quality fluctuations, and insufficient secondary water supply pressure have concentrated. The market has therefore changed significantly: on the one hand, renewal of aging pipe networks, renovation of secondary water supply facilities, and improvement of valve chambers and metering nodes have become rigid demands; on the other hand, digital monitoring, leakage assessment, district-based governance, and operation services have become important investments for water utilities to improve management efficiency.
Funding Diversification
Beyond self-financing, sources include urban renewal special funds, local government special bonds, central budget investment, water-saving renovation projects, resilient city construction funds, and contract water-saving management.
Integrated Solutions
Large cities adopt "detection—district construction—pressure optimization—smart metering—platform operation—repair closed loop." Small/medium cities focus on low-cost, replicable pathways prioritizing trunk main leakage and night flow anomalies.
Market demand structure is also changing. The traditional market placed greater emphasis on hardware procurement such as pipes, valves, and water meters, while the future will emphasize the combined value of "hardware + software + services." Pipe network leakage control cannot be completed simply by installing a batch of smart water meters; it requires continuous data governance, field inspections, repair work orders, leak point verification, and performance evaluation. Industry observations show that equipment investment alone often yields only short-term improvements. Only by incorporating leakage rate into operational assessments and establishing a stable data closed loop can leakage rate rebound be avoided. This is also driving water utilities to shift from an "engineering construction mindset" to an "asset operation mindset," and from "reactive emergency repair" to "proactive leakage control."
III. Technical Directions: DMA, Pressure, Metering, and AI Form a Closed Loop
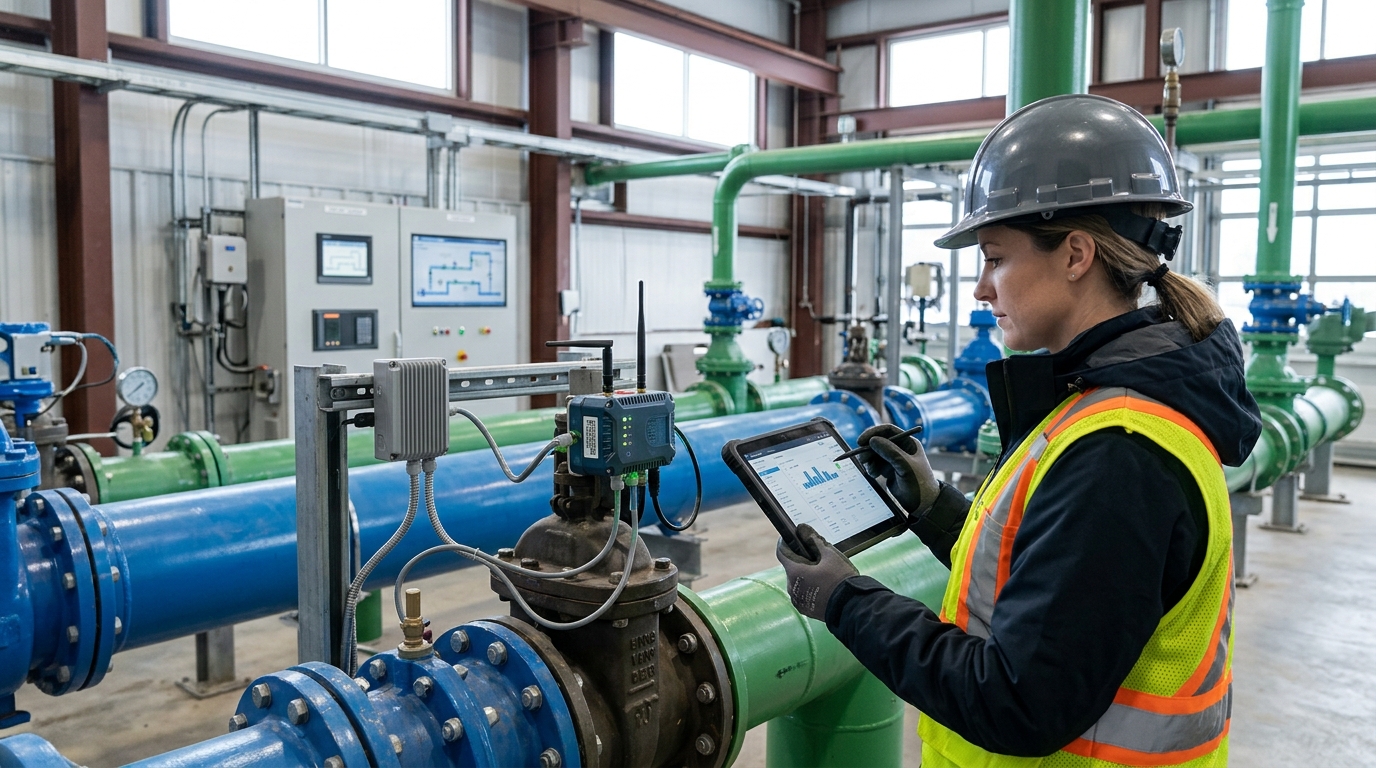
In the technical system for pipe network leakage control, DMA district metering is the core foundation. DMA, or District Metered Area, uses boundary valves, flow meters, pressure gauges, and acquisition terminals to divide urban pipe networks into several independently meterable zones. A typical primary DMA may cover tens of thousands of households or daily water supply of tens of thousands to hundreds of thousands of cubic meters, while secondary DMAs are further refined to residential blocks, streets, or key pipe network nodes. The key to zoning lies in reliable boundaries, accurate metering, and continuous data; otherwise, leakage analysis will be seriously disrupted by water imbalance and communication gaps. In industry practice, DMA size is often controlled between 500 and 2,000 households so that anomalies can be detected without reducing localization efficiency due to overly large zones.
Pressure management is an important lever for reducing leakage. The higher the pipe network pressure, the greater the leakage flow, and the higher the risks of joint seepage, bursts, and repair costs. By installing pressure control valves, optimizing storage and regulation facilities, adjusting pump station operation strategies, and implementing zone pressure reduction, ineffective leakage can be reduced while maintaining user water experience. Empirical data show that under reasonable pipe network structures and controllable water demand, each 1 bar reduction in pressure may reduce leakage by approximately 3% to 5%. However, pressure management cannot be a simple "one-size-fits-all" approach; it must be dynamically optimized in combination with end-point water pressure, fire protection demand, peak water use, water quality safety, and secondary water supply facility capacity, otherwise complaints or safety risks may arise.
Smart metering and detection technologies are accelerating integration. Electromagnetic flow meters, ultrasonic flow meters, smart water meters, pressure sensors, noise loggers, acoustic correlators, tracer gas detection, and fiber optic sensing provide multi-dimensional data for leakage identification. Smart water meters can improve end-user metering accuracy and reduce after-meter leakage and meter reading errors; flow meters can support DMA water balance; pressure gauges can identify abnormal fluctuations; acoustic devices can locate hidden leaks under low-noise nighttime conditions. Common industry parameters include: data acquisition frequency ranging from 15 minutes to 1 hour, flow meter accuracy reaching ±1% to ±2%, smart water meter errors typically controlled within ±2%, acoustic localization error reducible to 0.5 to 2 meters, and edge terminal battery life reaching 6 to 8 years. In the future, AI algorithms will combine minimum night flow, pressure anomalies, burst waveforms, repair records, and pipe material data to form leakage prediction and repair prioritization.
IV. Case Insights: How District Metering Changes Leakage Detection Efficiency
Public project experience shows that a southern city, after its water supply pipe network leakage rate had remained in the 14% to 15% range for a long time, launched DMA district metering and pressure management renovation. In the initial stage, the water utility first surveyed pipe network topology, valve status, user metering coverage, and historical burst records, identifying issues such as unclear trunk main boundaries, lack of independent metering in some residential areas, and abnormal night flows that could not be located. Subsequently, the city built 32 primary DMAs and 86 secondary DMAs, deployed more than 400 pressure monitoring points, more than 200 large-diameter flow meters, and connected over 12,000 smart water meters. After the system went live, leakage analysis shifted from "monthly water balance" to "hour-level anomaly identification."
Project Results
- Leakage Reduction: Fell from ~14.8% to 9.3%
- Water Savings: ~4.5 million cubic meters annually
- Response Time: Average repair response shortened from days to <24 hours
- Detection: Identified 38 suspected leak points via AI/anomaly analysis
Within six months of operation, the platform cumulatively identified 38 suspected leak points through minimum night flow anomalies, sudden pressure changes, and user-side water consumption deviations. These included 11 after-meter leaks on the user side, 9 valve chamber seepage leaks, 6 concealed pipe body leaks, and several joint seepage leaks. After field verification, the average repair work order response time was shortened from several days to within 24 hours, and some trunk main leaks were isolated and repaired within 4 hours. Project evaluation showed that the city's public water supply pipe network leakage rate fell from approximately 14.8% to 9.3%, saving about 4.5 million cubic meters of water annually, while reducing outage impacts from burst repairs and water quality fluctuation risks.
This case demonstrates that zoning and metering themselves are not the objective, but the foundation for forming a management closed loop. Without DMAs, leakage rate analysis often remains at the aggregate level, making it difficult to determine whether the problem lies on a specific trunk main, in a particular area, or among a certain user category. Without smart metering, after-meter leakage and meter reading errors can mask the true condition of the pipe network. Without pressure monitoring, nighttime anomalies may be misjudged as normal fluctuations. Without repair work orders and performance evaluation, technical platforms can easily degrade into tools for "viewing data." The key to urban pipe network governance is to integrate detection, analysis, dispatch, repair, and renewal into the same process, making leakage rate reduction a trackable, verifiable, and sustainable outcome.
V. Policy Impact: Assessment, Funding, and Standards Reshape the Industry
Policy influence on pipe network leakage control is first reflected in target constraints. After leakage rate indicators were incorporated into assessment systems for water-saving city construction, urban physical examinations, water supply safety management, and infrastructure renewal, water utilities are no longer simply completing engineering renovations; they must establish long-term ledgers, conduct periodic assessments, and provide public reports. Local competent departments will also link leakage rates to pipe network renewal plans, funding arrangements, project acceptance, and performance of enterprise executives. This assessment mechanism is driving the industry from a "project-based" model to an "operations-based" model, and from "one-time renovation" to "continuous control."
The standards system is also being improved in parallel. Pipe network leakage control involves multiple stages, including water supply pipe network surveys, DMA construction, metering instrument verification, data acquisition, pressure management, leakage detection, burst early warning, and repair quality. Industry standards and local specifications are gradually clarifying zoning boundaries, metering accuracy, data frequency, leakage assessment methods, and acceptance indicators. In the future, as pipe network digitalization increases, standards will not only prescribe "what equipment to install," but also "how data forms a closed loop." For example, DMAs must reach a state that is calculable, alarmable, locatable, and verifiable; smart metering data must be integrated with GIS, SCADA, customer service systems, and repair work orders; leakage rate statistics must distinguish actual leakage, metering errors, after-meter leakage, and unauthorized water use.
Funding policies also affect market pace. Urban renewal and underground pipe network renovation provide a window for aging pipe network renewal, while special bonds and central funds enable water utilities to invest in detection, zoning, platform construction, and repair renovation. Contract water-saving management links water-saving benefits to project investment, reducing the pressure of one-time payments by water utilities. In the future, policies may further encourage integrated "investment, construction, management, and operation," supporting third-party professional institutions to participate in leakage detection, data analysis, repair services, and performance verification. However, it should be noted that policy promotion cannot replace scientific assessment. Without pipe network surveys, hydrological boundaries, user structure, and pressure safety analysis, blindly deploying systems may result in wasted investment.
VI. Forward-looking Judgments: Urban Pipe Networks Enter the "Computable Asset" Phase
In the future, urban pipe networks will no longer be merely hidden underground assets, but computable, predictable, and optimizable digital assets. The next upgrade of pipe network leakage control will move from "finding leak points" to "predicting risks." By integrating GIS pipe network topology, SCADA operation data, smart water meters and flow meters, pressure sensors, repair work orders, pipe material age, soil corrosion, traffic loads, historical burst records, and water quality parameters, water utilities can build pipe network health scoring models and implement predictive maintenance for high-risk pipe segments. Leakage rate management will also expand from a result indicator to a comprehensive decision indicator that includes risk probability, repair cost, outage impact, and water quality safety.
Digital twins will become an important direction. Digital twins are not simply three-dimensional visualization, but mapping physical pipe networks into simulable and inferable systems in digital space. Managers can simulate the impact of different pressure scenarios on leakage, predict the scope of burst impacts, assess the disruption of outage repairs to residents and industrial users, and optimize emergency repair routes and valve closure strategies. For large cities, digital twins can improve complex pipe network dispatching capability; for small and medium-sized cities, lightweight models can enable key node monitoring and anomaly alarms. Industry observations hold that the value of future pipe network digital twins lies not in display effects, but in whether they can reduce leakage rates, lower burst losses, improve water quality stability, and optimize investment priorities.
Green and low-carbon development will also become a new variable in pipe network leakage control. Water supply systems themselves are high energy consumption systems; abstraction, treatment, distribution, and secondary pressurization all require substantial electricity. Pipe network leakage not only wastes water resources, but also means that energy, chemicals, and carbon emissions in water treatment and conveyance are consumed ineffectively. Some research places the unit energy consumption of water supply systems in the range of 0.3 to 0.8 kWh per cubic meter; although differences among cities are large, lower leakage rates are usually accompanied by reduced energy intensity. In the future, leakage rate management may be combined with carbon accounting, water-saving evaluation, and ESG disclosure. Water utilities will not only report leakage rates, but also report energy savings, carbon emission reductions, and service quality improvements resulting from water conservation.
VII. Conclusion and Outlook: From Reducing Leakage to Enhancing Urban Resilience
Urban pipe network leakage control is undergoing a transition from indicator-based governance to system-based governance. In the short term, policy targets are driving water utilities to accelerate DMA construction, smart metering deployment, and leakage detection. In the medium term, aging pipe network renewal, pressure optimization, and repair closed loops will determine whether leakage rates can decline stably. In the long term, data governance, predictive maintenance, and digital twin capabilities will determine whether urban pipe networks possess true resilience. Reducing leakage rates from 15% to 9%, and further approaching 7%, is not merely a numerical change, but a leap in urban infrastructure management capability.
Over the next five years, the industry will present three trends. First, zoning and metering will extend from trunk pipe networks to secondary water supply, key users, and old residential areas, forming more fine-grained leakage identification capabilities. Second, leakage control will move from coordination within a single water supply department to multi-department linkage involving municipal administration, emergency response, ecological environment, housing and urban-rural development, water conservancy, and street communities, improving burst handling and outage management efficiency. Third, pipe network assets will move from "post-event repair" to full lifecycle management including "condition assessment, predictive maintenance, and renewal prioritization." Urban pipe networks are no longer merely underground engineering; they are perceptible, computable, and optimizable urban lifelines. Whoever can truly close the loop on pipe network leakage, zoning, metering, pressure, data, and repair will seize the initiative in the next round of urban infrastructure upgrades.

