How a Water Utility Group Achieves Cost Reduction and Efficiency Improvement Through the Digitalization of Irrigation Districts
A case study on transforming an 860,000-mu Yellow River diversion irrigation district through data-driven water distribution, resulting in significant water savings and operational efficiency.
Irrigation Area
860,000 mu
Designed area across three main canals
Water Savings
38.6M m³
Annual reduction in Yellow River diversion
Introduction: Irrigation District Informatization Enters the Stage of Data-Driven Water Distribution
Against the backdrop of continuously strengthened agricultural water conservation and rigid constraints on water resources, irrigation district informatization is no longer just about installing software, deploying cameras, or simply recording water levels. Instead, it requires integrating inflow forecasting, canal water conveyance, cross-section flow measurement, gate control, field water demand, and water user services into a single data closed-loop. For large and medium-sized irrigation districts primarily relying on canal water conveyance, the core objective of informatization projects is to shift water scheduling from empirical judgment to model-based calculation, transition flow measurement from estimation and conversion to actual cross-section measurement, and advance smart irrigation from demonstration concepts to replicable operations.
This article takes the smart irrigation district informatization transformation project of a Yellow River diversion irrigation district in the upper reaches of the Yellow River as an example, reviewing the project background, technical challenges, solutions, implementation process, and final outcomes. The irrigation district has a designed irrigation area of 860,000 mu and an actual irrigation area of 724,000 mu. It comprises 3 main canals with a total length of 168.6 km, 42 lateral canals with a total length of 312.8 km, and over 1,200 km of tertiary and lower-level canals. The project was led by the irrigation district management unit, with Yicai Technology providing informatization and intelligent control technical support. Upon completion, the effective utilization coefficient of irrigation water increased from 0.483 to 0.562, the annual total water diversion from the Yellow River decreased by approximately 38.6 million cubic meters, and the flow measurement coverage rate for main and lateral canals improved from 58.7% to 93.4%, providing a verifiable engineering benchmark for similar irrigation districts.
Project Background: Water Conservation Pressures and Scheduling Pain Points
Located on the left bank of the upper Yellow River, this irrigation district is a typical gravity-fed Yellow River diversion district, with a multi-year average water diversion quota of 432 million cubic meters. The cropping structure mainly consists of corn, wheat, sunflowers, alfalfa, and facility vegetables, featuring a high multiple cropping index and overlapping peaks for spring and summer irrigation. In the past, the district long operated under a model of "allocating water by acreage, opening gates by experience, and rotating irrigation by cycle," resulting in significant water conveyance losses in canals. Some lateral and lower-level canals still relied on earthen channels for water conveyance, and field irrigation primarily used border and furrow methods, with per-mu irrigation water consumption consistently maintained at around 520 cubic meters.
With the advancement of regional total water use control, groundwater extraction reduction, and the comprehensive reform of agricultural water pricing, the irrigation district management unit faces three main pressures:
- Tightening Water Quotas: Requiring reduced total water use without decreasing irrigated area or grain production capacity.
- Weak Flow Measurement Foundation: Most lateral canal inlets rely on conversion factors for estimation, hindering accurate water fee collection.
- Inefficient Scheduling: Reliance on telephone calls and manual records leads to significant water level fluctuations and upstream-downstream conflicts during peak seasons.
In 2022, the local water authority launched the irrigation district informatization transformation project, aiming to build a perception system covering the canal headworks, main canals, lateral canal inlets, key tertiary canals, and typical field blocks within 18 months. The quantified targets set during project approval included: an online monitoring coverage rate of no less than 90% for key cross-sections of main and lateral canals, a metering coverage rate of no less than 85% for lateral canal inlets, a remote gate control rate of no less than 75%, an increase in the effective utilization coefficient of irrigation water to above 0.55, and a reduction in per-mu irrigation water consumption by no less than 60 cubic meters.
Technical Challenges: Four Critical Hurdles
Pre-project site surveys indicated that the informatization transformation of the irrigation district was not merely about adding equipment, but required resolving disconnections across four levels: perception, communication, scheduling, and execution.
1 Complex Flow Measurement Conditions
Various canal cross-section types (trapezoidal concrete-lined main canals vs. rectangular/trapezoidal lateral canals) and issues like siltation and weed overgrowth make single-device measurement ineffective.
2 Uneven Communication & Power Supply
Lateral canal inlets often lack stable 4G signals and municipal power. Initial wireless tests showed a 11.6% packet loss rate, unacceptable for linked gate scheduling.
3 Lack of Closed-Loop Control
Existing gates are mostly manual or partially electric. Without precise actuator feedback, scheduling platforms cannot achieve true intelligent control based on real-time water levels.
4 Business Collaboration Silos
Data standards are inconsistent across grassroots stations and water user associations. Water fees, plans, and usage records are scattered, requiring platform compatibility with diverse business processes.
Solutions: Integrated Construction of Perception, Transmission, Platform, Control, and Application
To address these challenges, the project adopts a five-layer architecture: perception, transmission, platform, control, and application.
Perception Layer
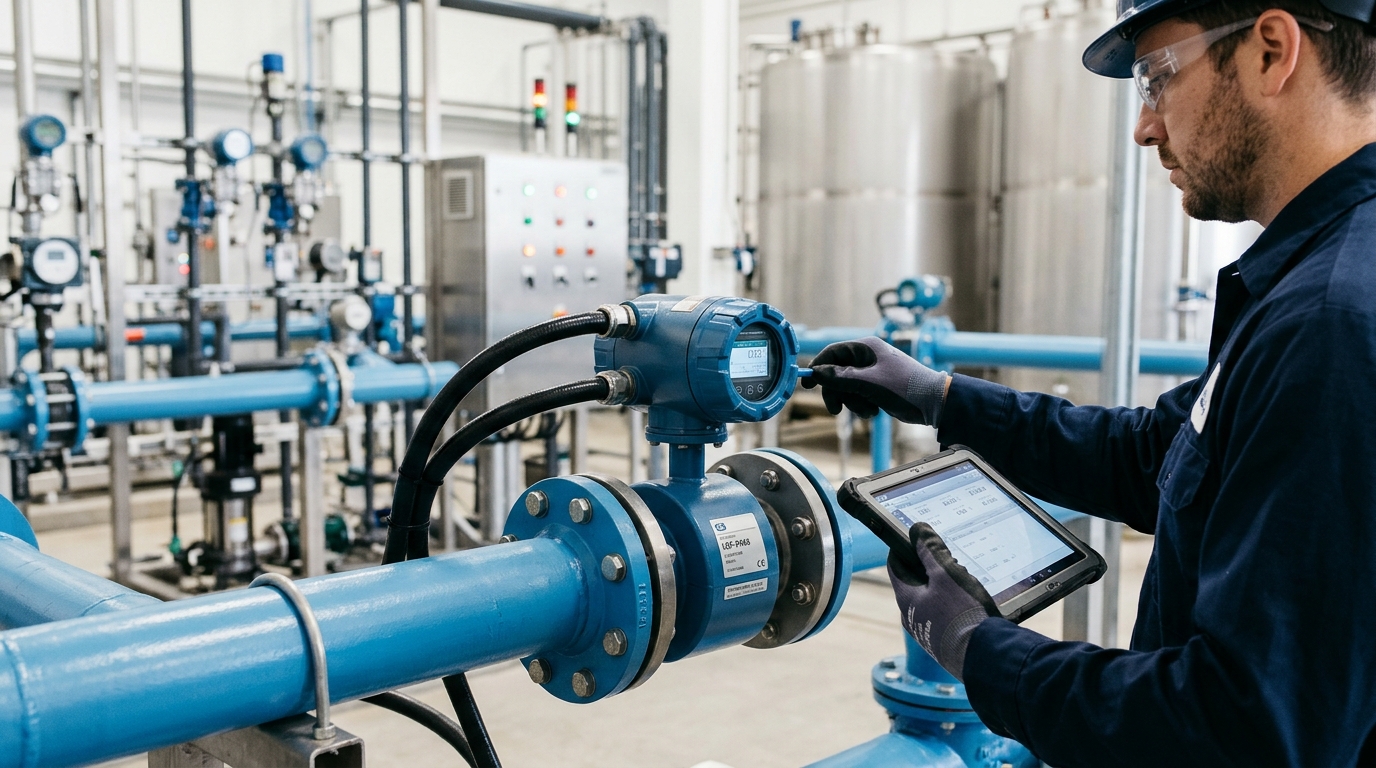
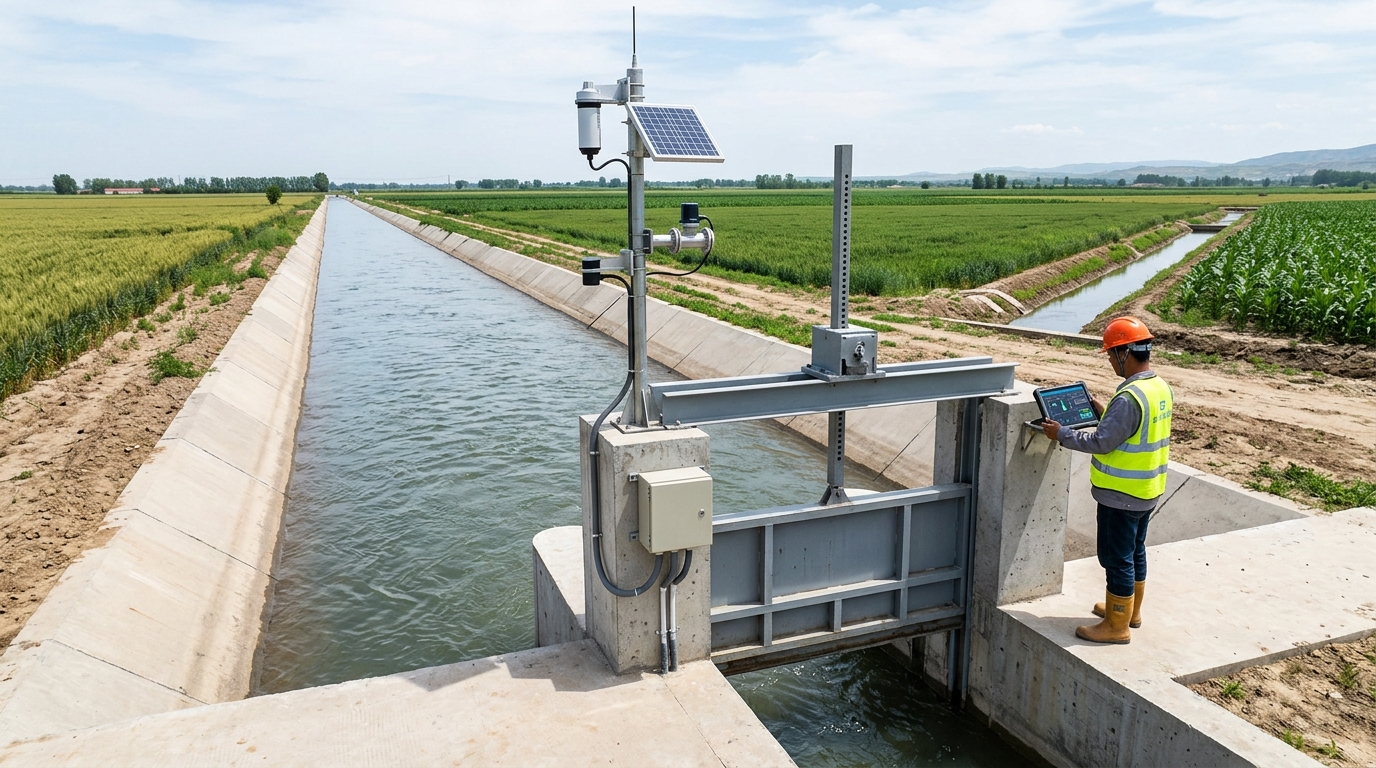
Focuses on monitoring water levels, flow rates, gate statuses, soil moisture, meteorological conditions, and video surveillance. A total of 216 monitoring points were deployed at the main canal headworks, main canal diversion gates, lateral canal inlets, and key tertiary canal inlets.
- 142 Radar water level gauges
- 36 Doppler flow profilers
- 24 Electromagnetic flowmeters
- 8 Ultrasonic open channel flowmeters
- 86 Sets of gate opening sensors
- 124 Video surveillance units
Transmission Layer
Utilizes a complementary approach of fiber optics, 4G, LoRa, and BeiDou short message services. Main canal hubs prioritize fiber optics; key gate points use 4G + solar power; lateral inlets aggregate via LoRa; blind spots use BeiDou emergency channels. System availability is designed to be ≥99.5%.
Platform & Control Layers
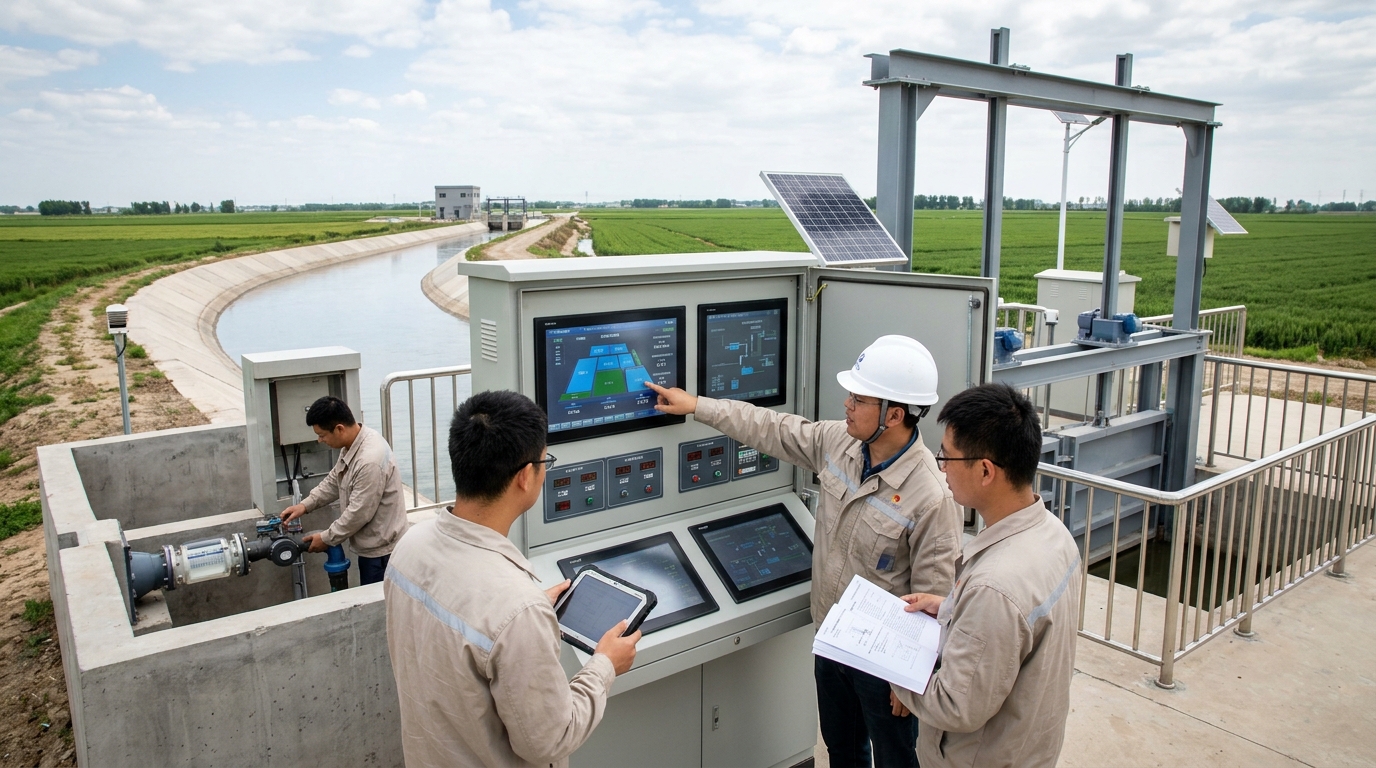
The unified dispatch center comprises eight modules: GIS overview, water condition monitoring, volume scheduling, flow measurement management, gate control, irrigation planning, water fee collection, and mobile inspection. The control layer completed remote upgrades for 86 gates with ±1 cm opening accuracy.
Smart Field Irrigation Pilot
Piloted in two demonstration zones (12,000 mu), deploying soil moisture sensors and small meteorological stations. Irrigation decisions shifted from manual patrols to data-triggered actions, reducing field irrigation labor by approximately 35%.
Implementation Process: Three-Phase Construction
Phase One (5 Months)
Completed monitoring/control upgrades for canal headworks, main canals, and 22 diversion gates. Built dispatch center server room and basic platform. Installed 64 km of fiber optic cable and 58 video units.
Phase Two (7 Months)
Covered 42 lateral canal inlets and 48 lateral canal gates. Completed flow measurement calibration, LoRa network deployment, and launched mobile inspection functions.
Phase Three (6 Months)
Constructed tertiary canal metering, soil moisture/meteorological stations, and smart irrigation demonstration zones. Integrated water fee collection module with farmers' water user associations.
During implementation, the most challenging part was calibration and joint commissioning. Before spring irrigation, the team conducted three rounds of calibration on 36 key cross-sections. The platform initially operated in "recommended opening" mode before transitioning to remote control. After one year of operation, equipment online rate remains above 97.8%, with data integrity at 98.6%.
Final Outcomes and Outlook
Key Performance Improvements
Water Diversion Reduction
~38.6M m³
Annually
Utilization Coefficient
0.483 → 0.562
Significant Efficiency Gain
Metering Coverage
58.7% → 93.4%
Main & Lateral Canals
Detailed Impact Analysis
Water Conservation: Annual Yellow River water diversion decreased from ~429M m³ to ~390M m³. Per-mu irrigation water consumption dropped from 518 m³ to 456 m³. In the smart demonstration zone, consumption was as low as 312 m³, with corn irrigation frequency dropping from 5 times to 3 times per season.
Metering & Transparency: Online monitoring coverage reached 93.4%, and lateral inlet metering hit 88.9%. Water fee disputes decreased by ~46%. Daily water volume reports and distribution orders are now automated, reducing auditing time from 3 days to half a day.
Scheduling Efficiency: Remote control ratio for gates reached 78.3%. Routine water distribution instruction time shortened from 4 hours to under 30 minutes. Main canal water level fluctuation narrowed from ±18 cm to ±7 cm, significantly improving stability for downstream users.
Looking ahead, the irrigation district plans to integrate more field data to explore digital twin models for simulating canal conveyance, flood scheduling, and drought warnings. This project establishes a replicable model for "data monitoring, model calculation, remote execution, and result feedback," paving the way for the modernization of large-scale irrigation districts.