From Technical Challenges to Successful Implementation: A Case Study of a Smart Water Management Project
Exploring how a large irrigation district in the Huai River Basin transitioned from experience-based water supply to refined, data-driven allocation through smart informatization.
Project Background: The Shift to Refined Allocation
In October 2024, a large irrigation district in the Huai River Basin completed the final acceptance of its informatization and smart irrigation project. Led by the district administration office with participation from Yicai Technology, the project covered a design area of 426,000 mu and an effective area of 318,000 mu, serving 15 townships and 42,000 water-use entities.
Pre-Renovation Status
- Metering coverage: Only 31%
- Flow estimation error: 8%–12%
- Water utilization coefficient: 0.48
- Irrigation guarantee rate: ~78%
- Water fee collection rate: ~72%
Core Objectives
Shift from "time-based release" to "demand-based allocation," solving issues where water could not be clearly seen, metered accurately, or managed finely.
Traditional management relied on manual gate opening and paper ledgers, resulting in dispatch response times of 1–2 days.
Technical Challenges: Engineering & Operational Constraints
Incomplete Measurement System: A wide flow span (65 m³/s at head vs. 0.1–0.6 m³/s at outlets) made single sensors inaccurate. Sedimentation and roughness variations affected stage-discharge relationships.
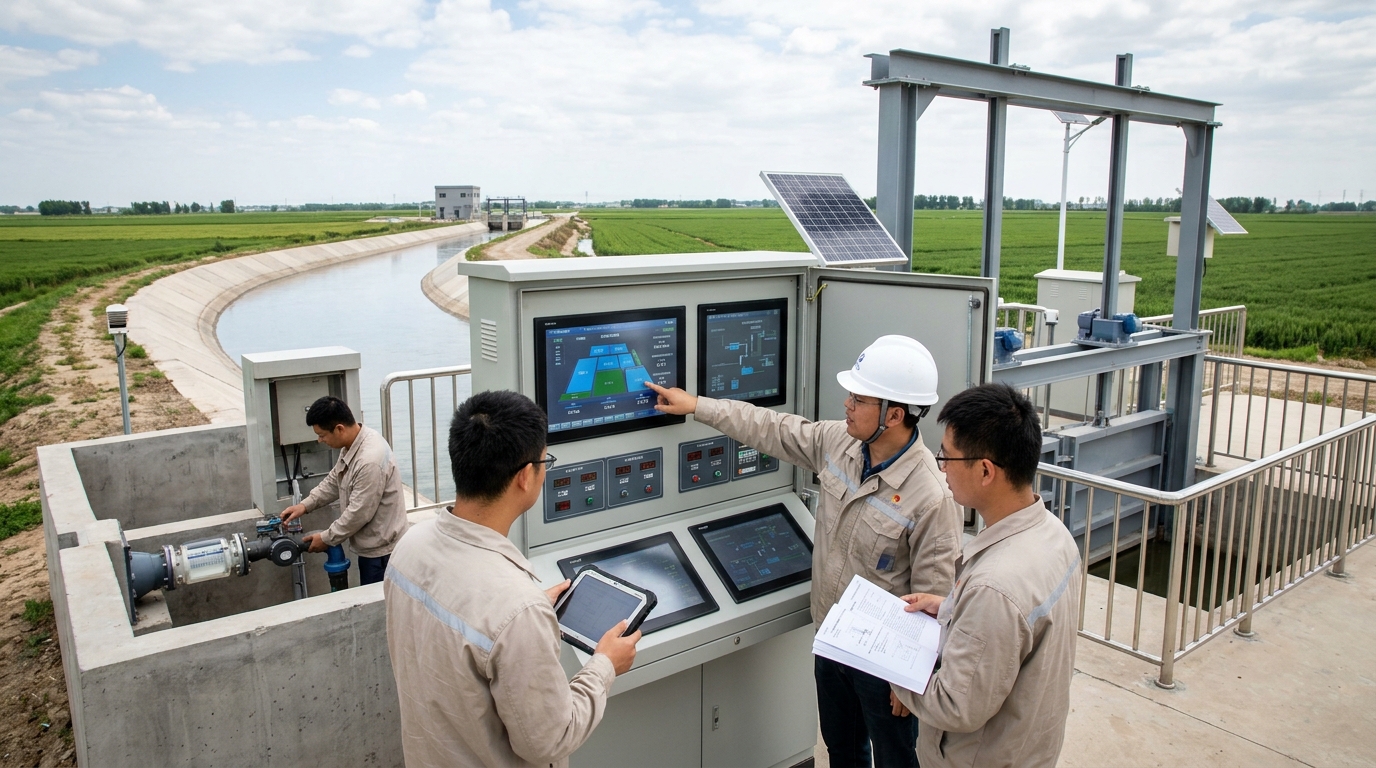
Environment & Power: 284 dispersed outlets faced unstable 4G signals and harsh outdoor conditions (thunderstorms, humidity). Solar power required ensuring stability during continuous rainy weather.
Aging Gate Renovation: Construction had to avoid critical spring (Mar–May) and autumn (Sep–Oct) irrigation windows while retaining manual operation capability for emergency dispatch.
Data Silos: Inconsistent ledger formats across stations hindered linkage between water fees, irrigation records, and equipment maintenance. A unified data model was essential.
Solution: Four-Layer Smart Architecture
The project adopted a "Perception—Transmission—Platform—Execution" architecture, creating a closed loop around the actual water use process.
? Perception Layer
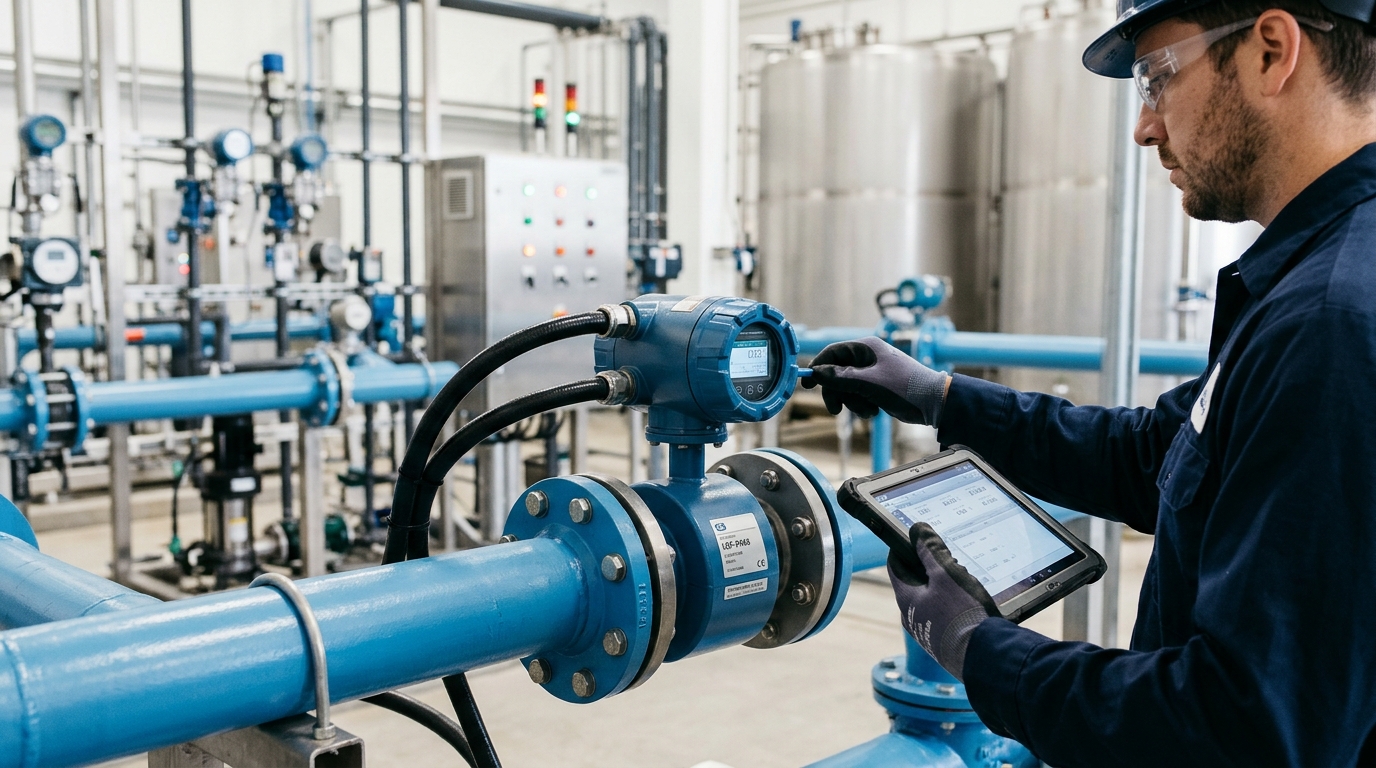
Collected water level, flow, gate opening, soil moisture, meteorological data, and video images using radar/ultrasonic gauges and open-channel flow meters.
? Transmission Layer
Ensured stable data upload via 4G, LoRa gateway aggregation, and dual-SIM redundancy for critical sections. Supported 30-day local caching during outages.
? Platform Layer
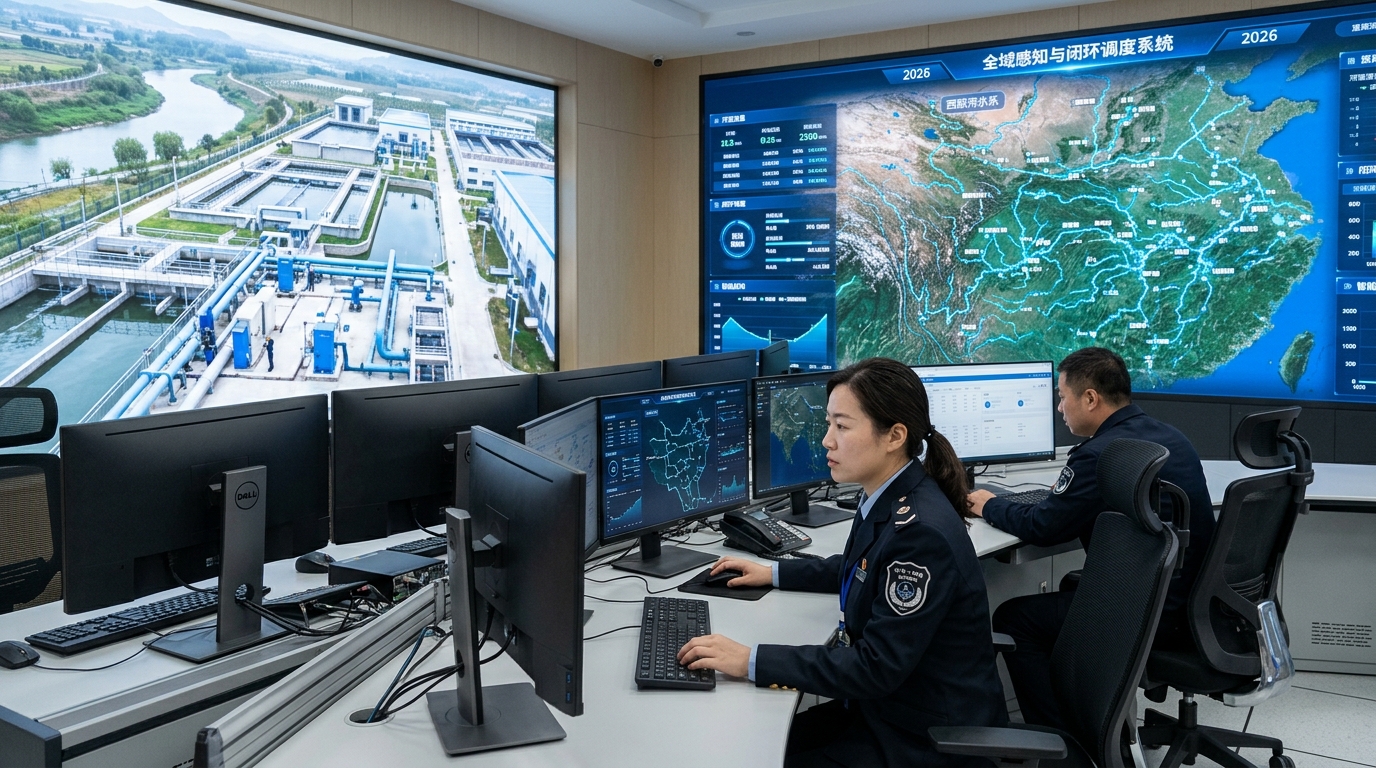
Managed data governance, dispatch analysis, water rights, fees, and O&M. Integrated with provincial water resources systems and financial collection platforms.
⚙️ Execution Layer
Included electric gates with remote control, alarm prompts, and field handling processes. Retained manual backup for reliability.
Key Accuracy Metrics
- Radar water-level gauge error: ±1 mm
- Gate position measurement error: ±0.5 cm
- Target combined open-channel flow error: ±3%
Implementation Strategy: Phased & Non-Intrusive
Total construction took 16 months, divided into three phases: demonstration zone (120,000 mu), full-area rollout, and platform integration/testing.
Pilot construction focusing on 80 field outlets to validate technical solutions.
Full deployment covering remaining branch canals and outlets, utilizing night work and shutdown windows.
System stress testing (1,000 devices concurrent), training (~420 person-times), and trial operation.
To minimize disruption, old gates were retrofitted with electric hoists (25 kN-class) while retaining manual screw/winch operations. Prefabricated components shortened curing time for new measuring cross-sections.
Impact: From Time-Based to Demand-Based
Smart Dispatch Example
During a heatwave in June 2024, the system analyzed soil moisture and recommended rotational irrigation instead of uniform release. This saved 850,000 m³ of water and reduced tail-end waiting time from 6 hours to under 2 hours.
Crop-Specific Quotas
- Wheat target: ~420 m³/mu
- Corn target: ~360 m³/mu
- Vegetables: 220–320 m³/mu
Data Governance & Alarms
Automated anomaly detection triggered 126 valid alarms during trial operation, including suspected leaks and device offline events. One detected canal bottom collapse prevented a daily loss of ~10,400 m³.
Metering Coverage
Field-outlet metering coverage increased from 31% to 98.6%, enabling precise billing and dispute resolution.
Final Results: Quantifiable Benefits
| Metric | Before | After | Improvement |
|---|---|---|---|
| Water Utilization Coefficient | 0.48 | 0.57 | +18.7% |
| Irrigation Guarantee Rate | 78% | 91% | +13 pts |
| Avg. Water Use per Mu | 480 m³ | 365 m³ | -24% |
| Water Fee Collection Rate | 72% | 96% | +24 pts |
| Dispatch Response Time | 1–2 Days | < 2 Hours | Significant |
Economic Analysis
Total Investment: 38.6 million yuan (approx. 121 yuan/mu).
Estimated Annual Comprehensive Benefits: ~6.8 million yuan, driven by water savings (2.64–3.3M), improved collection (1.2M), and reduced labor/leakage costs.
Static Payback Period: Approx. 5.7 years.
Outlook: Entering the O&M Value Stage
Construction is only the starting point. Future efforts focus on upgrading the platform from a "dispatch tool" to a "decision support system."
- Model Refinement: Continuously correcting irrigation thresholds based on localized soil types and meteorological data.
- Policy Integration: Deepening links between metering data, water rights trading, and progressive surcharges.
- Digital Twin: Introducing lightweight models to simulate gate-opening schemes virtually, reducing field test costs.
- Expansion: Adding 50,000 mu of high-efficiency water-saving irrigation areas in vegetable and facility agriculture zones.
"Irrigation district informatization is not a simple technology upgrade, but a systems engineering effort... device accuracy, model parameters, management systems, and user habits jointly determine project outcomes."