Urban Waterlogging Early Warning Daily Maintenance and Troubleshooting Manual
Ecolor Technology Industry Insight: End-to-End Practical Operations and Technical Guide for Urban Waterlogging Early Warning Systems
With the intensification of global climate change and the increasing frequency of extreme rainfall events, urban waterlogging has become a significant “urban disease” that threatens the operational safety of modern cities and constrains high-quality development. In flood prevention emergency management, how to shift from “passive emergency rescue” to “proactive defense” and establish a scientific, precise, and efficient urban waterlogging early warning system is a major challenge for water affairs, municipal, and emergency management departments at all levels. Ecolor Technology, as an industry technology observer and researcher, based on extensive front-line engineering practice and technical data analysis, hereby releases the “End-to-End Practical Guide for Urban Waterlogging Early Warning Systems.” This guide deeply integrates core processes such as waterlogging monitoring, radar sensing, data warning, and flood prevention dispatch, aiming to provide industry practitioners, engineering contractors, and system O&M personnel with an objective, professional, and highly operable technical reference document.
I. Architecture of Urban Waterlogging Early Warning Systems and Physical Mechanisms of Radar Sensing Technology
A modern urban waterlogging early warning system is a highly integrated Internet of Things (IoT) and cyber-physical system (CPS). Its core architecture is typically divided into four layers: the perception layer, the network layer, the platform layer, and the application layer. The perception layer is the system’s “nerve endings” and directly determines the accuracy and reliability of the data. Among numerous water level monitoring technologies, non-contact millimeter-wave radar technology has become the mainstream choice for urban waterlogging monitoring because it is unaffected by temperature, humidity, atmospheric pressure, wind and sand, and floating objects on the water surface.
Radar water level gauges mainly use frequency-modulated continuous wave (FMCW) technology. Their physical mechanism is as follows: the radar antenna transmits a microwave signal downward toward the water surface, with the frequency varying linearly over time, typically in the 60 GHz or 80 GHz band. When the microwave signal encounters the water surface, where the dielectric constant changes abruptly, a strong reflected echo is generated. The radar receiver captures the echo signal and mixes it with the currently transmitted signal to obtain a beat frequency signal. Based on the frequency of the beat signal, the system can calculate the spatial distance from the radar antenna to the water surface extremely precisely using the Fast Fourier Transform (FFT) algorithm. Combined with the preset radar installation height, i.e., the empty distance, the system can convert the measurement in real time into the absolute elevation of the current water level or the relative waterlogging depth.
In terms of actual parameter performance, the measurement accuracy of a professional-grade 80 GHz radar water level gauge can typically reach ±2 mm to ±3 mm, with a measurement blind zone of less than 0.1 m and a beam angle controllable within 8 degrees. This narrow-beam design effectively avoids multipath effects and false echo interference caused by complex urban environments, such as bridge piers, sewer shaft walls, and roadside barriers, ensuring stable output of waterlogging depth data even under adverse meteorological conditions such as heavy rain and providing a solid data foundation for subsequent flood prevention decision-making.
II. Scientific Site Selection of Monitoring Points and Pre-Construction Preparation Standards
Technology accounts for 30%, while implementation accounts for 70%. The effectiveness of an urban waterlogging early warning system depends largely on the scientific selection of monitoring sites. Improper site selection can not only cause monitoring data to lose representativeness, but may also lead to critical problems such as equipment damage and unreliable communication. The establishment of flood prevention monitoring sites must be based on a comprehensive assessment of urban topographic maps, historical waterlogging disaster data, underground pipe network distribution maps, and hydrological and hydrodynamic models.
In terms of site selection strategy, the primary objective is to cover high-risk waterlogging-prone points in the city. These include, but are not limited to, underpasses, railway culverts, low-lying communities, underground garage entrances, metro station entrances and exits, and bottlenecks in drainage pipe networks in older urban areas. For underpasses, it is recommended to place the main monitoring point at the lowest point of the bridge, i.e., the water accumulation center, and to install one auxiliary monitoring point on each side of the approach ramps to form a dynamic monitoring network for the spread of waterlogging. At the same time, site selection must consider the clearance requirements of the radar beam. From the radar directly downward to the water surface, a cone-shaped space bounded by the beam angle must be kept free of fixed obstacles, such as tree branches, cables, and traffic signs.
Pre-construction preparation is equally complex and critical. The first step is to survey the power supply and communication environment. Urban waterlogging monitoring devices typically use a solar power and mains power complementary mode. If solar power is used, the annual sunshine conditions at the installation site must be evaluated to ensure that the solar panels, typically recommended as 50 W to 100 W monocrystalline silicon panels, face due south and are not shaded by buildings. The capacity of the accompanying lithium iron phosphate gel battery should be no less than 40 Ah to ensure that the system can continue to operate normally for 7 to 10 consecutive cloudy or rainy days. In terms of communication, a field strength meter must be used to test the on-site 4G/5G or NB-IoT signal strength. The Received Signal Strength Indicator, RSSI, should be better than −85 dBm. If the signal is extremely weak, a high-gain directional antenna should be prepared in advance.
In addition, before construction, relevant administrative procedures such as road occupation construction approvals and streetlight pole use agreements must be completed. Prepare poles compliant with national standards, recommended height 3.5 m to 4.5 m, made of galvanized steel pipe with a wall thickness of no less than 4 mm; 304 stainless steel mounting brackets; lightning protection grounding components; and IP68-rated waterproof connectors and cables. All devices must have their base parameters flashed and undergo joint debugging tests in a laboratory environment before leaving the warehouse. It is strictly prohibited to bring unverified “bare devices” directly to the construction site.
III. Core Hardware Installation Practices: Radar Water Level Gauge and Telemetry Terminal Deployment
Hardware installation is the core step in deploying the entire early warning system. Construction quality directly determines the service life of the system and the quality of the data. The installation process must strictly follow standard operating procedures (SOPs).
- The first step is pole and foundation construction. If no usable streetlight pole or surveillance pole is available on site, an independent pole must be installed. The foundation excavation depth should be no less than 0.8 m, with a 10 cm crushed stone cushion laid at the bottom. After placing the embedded parts, C25-grade concrete is poured. The flange of the embedded parts must be leveled with a spirit level, and the error must not exceed 1 degree. Only after the foundation has cured, typically requiring 48 hours, can the pole be lifted into place. Power cables and communication cables must be pre-routed inside the pole to avoid accelerated aging or human damage caused by external wiring.
- The second step is the precise installation of the radar water level gauge. The installation attitude of the radar sensor is the key factor determining measurement accuracy. Use a gimbal adjustment bracket to fix the radar at the end of the horizontal arm, and ensure that the radar transmitting surface, i.e., the radome, is strictly parallel to the target water surface. In practice, construction personnel must use a high-precision electronic level placed on the back of the radar for dual-axis calibration, ensuring that the tilt angles of both the X-axis and Y-axis are less than 0.5 degrees. The installation height should be determined according to the radar range and blind zone. It is generally recommended to install the radar at least 1.5 m above the expected maximum water level to prevent extreme waterlogging from submerging the device. Fixing bolts must be tightened with a torque wrench. The recommended torque for M8 bolts is 45 N·m, and threadlocker adhesive should be applied to prevent loosening caused by long-term minor vibrations.
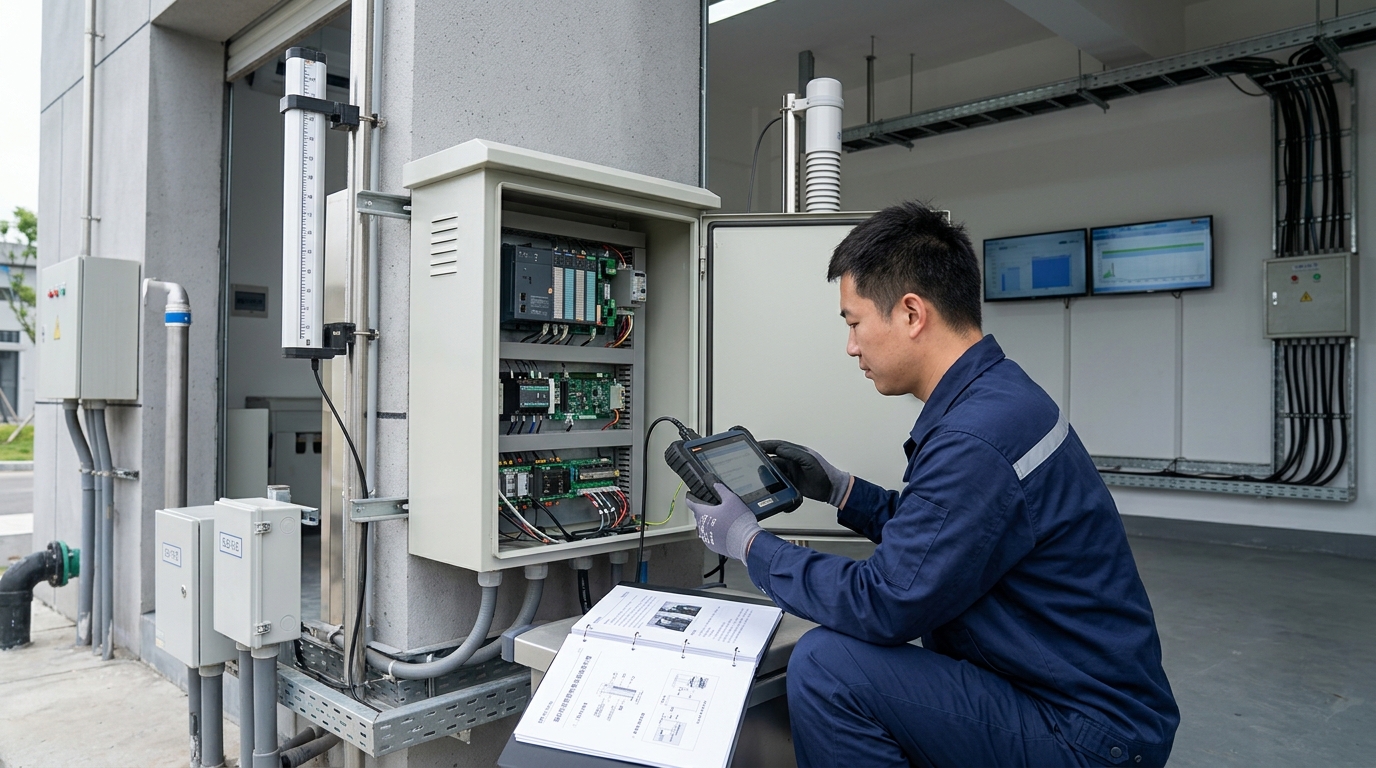
- The third step is wiring the Remote Terminal Unit (RTU) and the power supply system. The RTU is the “brain” of the system, responsible for collecting radar data and reporting it to the cloud. The protective enclosure should be installed on the back side of the pole, at least 2.5 m above the ground, to prevent human contact and flooding. Open the protective enclosure and perform wiring strictly according to the electrical schematic diagram. Radar water level gauges typically use an RS485 interface and the Modbus RTU protocol to communicate with the terminal. When wiring, A+ and B− must be correctly distinguished, and the shield wire must be grounded at one end only. All incoming and outgoing cable openings must be locked with waterproof cable glands, and flame-retardant silicone sealant must be applied inside. Lightning protection grounding is of utmost importance. The pole, equipment enclosure, and lightning rod must be connected to the grounding grid through a green-and-yellow two-color grounding wire with a cross-sectional area of no less than 16 mm². Use a grounding resistance tester to measure and ensure that the grounding resistance is strictly less than 4 ohms to resist induced lightning strikes during thunderstorms.
IV. System Parameter Debugging and Radar Beam Calibration Standards
After hardware installation is completed and power is supplied, the system enters the critical debugging stage. At this stage, on-site engineers and back-end data analysts must work closely together, using professional configuration software to fine-tune low-level parameters.
- Communication link testing: Use a laptop with a USB-to-RS485 serial cable to connect the radar sensor, open the host configuration software, and set the correct baud rate, typically 9600 bps, data bits, 8, stop bits, 1, and parity, none. After a successful connection, read the radar’s current echo curve. A healthy echo curve should show a sharp and high peak at the true water surface distance, with a signal-to-noise ratio (SNR) typically greater than 20 dB, while background noise at other distance ranges should remain low.
- Calibration of the core parameter “empty distance”: The empty distance refers to the absolute physical distance from the radar antenna transmitting surface to the bottom of the monitoring point, such as the road surface or ditch bottom. The accuracy of this parameter directly determines the calculated waterlogging depth, where waterlogging depth equals empty distance minus the current distance measured by the radar. In practice, a laser rangefinder certified by national metrology authorities or a high-precision steel tape measure must be used to vertically measure the distance from the radar to the ground. At least three measurements should be taken and averaged, and the resulting value, accurate to the millimeter, should be written into the radar’s internal registers.
- Configuring false echo suppression and filtering algorithms: In urban road environments, large vehicles occasionally passing by, manhole covers on the road surface, and even tree branches swaying in the wind may create interference peaks on the radar echo profile. During debugging, while the site is dry and free of waterlogging, the operator must command the radar to scan the static echo of the current environment and store it as a “background map.” During subsequent operation, the system automatically compares real-time echoes with the background map and masks fixed interference objects. At the same time, a smoothing filter algorithm, such as a Kalman filter or moving average filter, must be enabled, and the filter window time should be set, for example, to 10 seconds. This means that the system will perform smoothing processing on data within a 10-second window, effectively filtering out instantaneous value jumps caused by water surface ripples or splashes from passing vehicles, ensuring that the output waterlogging depth data is smooth and true.
V. Data Networking and Tiered Setting of Flood Prevention Warning Thresholds
After the perception layer data is accurately acquired, it must be transmitted through a stable network to the flood prevention command platform and combined with scientifically set warning thresholds to truly achieve disaster prevention and mitigation benefits. Data networking typically uses MQTT or TCP/IP protocols, and the data format is often lightweight JSON. The RTU must be configured with the correct target server IP address, port number, and unique device identifier, such as an IMEI or custom ID. During the debugging stage, observe the RTU’s network registration status indicator and log in to the back-end platform to confirm the reception frequency of heartbeat packets and service data packets. Normally, when there is no rainfall, the system is set to report data once per hour to save power in sleep mode. Once the radar detects that waterlogging exceeds the initial threshold, the RTU should immediately trigger an interrupt and automatically switch to high-frequency reporting mode, such as reporting once every 1 minute or 3 minutes, to enable real-time tracking of flood prevention data.
The setting of warning thresholds is the trigger for flood prevention emergency response and must be customized and tiered according to the specific terrain characteristics of each site, traffic importance, and drainage capacity. Generally, urban waterlogging warnings are divided into four response levels: blue, yellow, orange, and red.
Using a typical underpass as an example, the practical threshold settings are as follows:
Level 1: Blue Warning (Attention)
Waterlogging depth is set at 10 cm. At this water level, vehicles can still pass, but obvious standing water is present on the road surface. After the system triggers a blue warning, the platform sends SMS messages to local grid personnel and drainage company patrol staff, prompting them to pay attention to this site, which may require clearing leaves and debris from rainwater grates.
Level 2: Yellow Warning (Alert)
Waterlogging depth is set at 20 cm. At this point, small passenger cars are at risk of stalling when driving through the water. The system triggers a yellow warning, links with the on-site LED variable message sign, and displays a warning message such as “Standing water ahead, slow down.” At the same time, an alarm pops up on the large screen of the flood prevention command center, and mobile pumping trucks are prepared for dispatch.
Level 3: Orange Warning (Danger)
Waterlogging depth is set at 27 cm, close to the average height of a car exhaust pipe. At this level, vehicle breakdowns are highly likely. The system triggers an orange warning, automatically links with the on-site audible and visual alarm, and can use relay output to control the automatic barrier gate to lower, implementing physical road closure. Traffic police simultaneously receive the instruction and proceed to the site to direct traffic.
Level 4: Red Warning (Extreme Danger)
Waterlogging depth is set at 50 cm or above. This water level seriously threatens personal safety. The system triggers a red warning, forcibly starts all fixed high-capacity drainage pump stations in the area, emergency rescue teams enter the highest standby level, and the urban emergency broadcast system issues detour and evacuation notices to nearby residents.
Threshold settings are not fixed. After the end of each flood season, flood prevention departments should review and dynamically fine-tune the thresholds for each site based on the actual rainfall and waterlogging evolution data of that year, in order to achieve the optimal balance between warning sensitivity and accuracy.
VI. Full-Lifecycle Routine Inspection and Standardized Maintenance
Urban waterlogging early warning systems are exposed for long periods to harsh outdoor environments and face multiple challenges such as high temperature, high humidity, lightning strikes, vehicle exhaust, and dust. To ensure that the system “measures accurately and transmits reliably” at critical moments, a standardized routine maintenance and inspection mechanism must be established throughout the equipment lifecycle. Maintenance work is divided into online remote inspection and offline physical inspection.
Online remote inspection is recommended to be performed daily by the O&M center. The main inspection indicators include:
- Device online rate: Confirming whether all sites maintain normal heartbeat connections.
- Battery voltage monitoring: The voltage of normally operating lead-acid or lithium batteries should remain between 11.5 V and 14.4 V. If the voltage of a site remains below 12 V during clear daytime conditions, it indicates a fault in the solar charging circuit or severe battery aging, and a work order must be issued immediately for handling.
- Data rationality review: Checking whether the waterlogging depth remains at 0 during rain-free weather, allowing for a ±5 mm zero drift. If persistent non-zero values appear, it may mean that the radar has been physically obstructed or displaced.
Offline physical inspection is recommended at the following frequency: once per quarter during the non-flood season, once per month during the flood season, and once before and once after heavy rainfall events. The practical checklist for on-site inspection should include:
- Appearance and structure inspection: Check whether the pole is tilted or rusted and whether bracket bolts are loose. In particular, the installation angle of the radar water level gauge must be rechecked with a spirit level to ensure that no angle deviation has occurred due to strong wind or external human force.
- Cleaning and maintenance: Urban roads have heavy dust, and the radome at the bottom of the radar, typically made of polytetrafluoroethylene (PTFE) or engineering plastic, is prone to accumulating mud crusts or spider webs. Although millimeter-wave signals have some ability to penetrate minor dirt, excessively thick mud can attenuate signal strength. The radar transmitting surface must be gently wiped with a soft damp cloth; the use of corrosive chemical solvents is strictly prohibited. At the same time, dust and bird droppings on the solar panel surface must be cleaned to restore photoelectric conversion efficiency.
- Cable and sealing inspection: Open the RTU protective enclosure and check whether there is water vapor condensation inside and whether the desiccant has discolored and failed, with immediate replacement required if it turns pink. Check whether all wiring terminals are tight and whether oxidation or blackening has occurred. Use a multimeter to measure the open-circuit voltage and short-circuit current of the solar panel to evaluate its health status. After testing, the protective enclosure must be securely locked again, ensuring that the waterproof sealing strip fits tightly.
VII. Typical Fault Troubleshooting Matrix and Emergency Response Plans
During long-term system operation, various sudden faults are inevitable. Establishing a scientific fault troubleshooting matrix can help front-line O&M personnel quickly locate problems and reduce system downtime. The following are troubleshooting and handling guidelines for several typical faults.
Fault Symptom 1: The platform shows the device offline, with no data reporting.
Troubleshooting path: First, distinguish between single-site offline conditions and widespread offline conditions. If widespread offline occurs, it is usually caused by a cloud platform server fault or a carrier base station network fault, and the IT department or network operator must be contacted. If only a single site is offline, the on-site troubleshooting sequence should follow “power–network–cable–device.”
- Step 1: Measure the power supply. Use a multimeter to check whether the RTU mainboard power terminal has a 12 V or 24 V DC input. If there is no power, check the battery voltage and whether the solar controller fuse has blown.
- Step 2: Check the network. Observe the RTU network indicator. If it flashes rapidly or does not light up, reseat the SIM card, check whether the antenna connector is loose, and if necessary replace the SIM card for testing.
- Step 3: Check the serial cable. Confirm that the RS485 cable has no open circuit or short circuit.
- Step 4: Device check. If all the above are normal, the RTU may be frozen or the hardware may be damaged. Try a power-off restart. If ineffective, replace with a spare RTU.
Fault Symptom 2: The device is online, but waterlogging depth data fluctuates abnormally, alternating between large and small values.
Troubleshooting path: This type of fault is mostly caused by radar signal interference.
- Step 1: Perform a physical environment check. Inspect whether new obstacles have appeared within the radar beam range, such as illegally parked large vehicles, newly hung banner cables, or rapidly growing tree branches in summer. Remove these physical obstructions.
- Step 2: Check the radar mounting bracket. Confirm whether strong winds have caused the bracket to loosen, resulting in radar shaking in the wind and continuously changing measured distances. Retighten and recalibrate the level.
- Step 3: Software configuration. Connect the configuration software and view the echo curve. If a fixed strong interference peak is found, re-execute the “false echo learning and suppression” operation.
- Step 4: Filter parameters. Check whether the filter parameters have been accidentally modified, and appropriately increase the damping coefficient of the smoothing filter.
Fault Symptom 3: During rainfall, the waterlogging data remains at zero or changes extremely slowly.
Troubleshooting path: This usually indicates that the radar ranging function has failed or that the communication protocol parsing is incorrect.
- First, check whether the radar probe has been completely blocked by thick mud.
- Next, use the software to read the radar’s raw distance value and check whether it is consistent with the actual empty distance.
- If the raw distance value is correct but the platform waterlogging depth does not update, it indicates that the RTU’s internal calculation logic (where waterlogging depth equals empty distance minus measured distance) is incorrect, or that the empty distance parameter on the cloud platform has been accidentally tampered with. The empty distance parameter must be rechecked and reissued.
- If the radar’s raw distance value remains fixed, the internal RF module of the radar may be damaged, and the device must be returned to the factory for repair.
For extreme situations that may occur during the flood season, flood prevention departments and O&M units must formulate emergency response plans. For example, before a typhoon or extreme heavy rain event, sufficient spare radars, RTUs, batteries, and cables must be stocked in advance. A 24/7 emergency repair team must be established, equipped with off-road vehicles, portable generators, inflatable boats, and insulated protective equipment. Once monitoring devices at core waterlogging-prone sites are damaged during heavy rain, the repair team must arrive on site within the specified time, such as 2 hours, while ensuring personal safety, and use temporary portable water level gauges or manual staff gauges for alternative monitoring, minimizing data blind spots for the flood prevention command center.
VIII. In-Depth Analysis: Case Study of Flood Prevention Warning in a Southern City with a Population Over 10 Million
To more intuitively demonstrate the practical value of urban waterlogging early warning systems, we introduce a flood prevention case from a southern megacity with a population exceeding 10 million. This city is located along the coast, experiences frequent summer typhoons, and has aging underground pipe networks in the old urban area. During heavy rainfall, many underpass tunnels and low-lying communities are highly prone to severe waterlogging, which has repeatedly caused submerged vehicles and large-scale traffic paralysis.
At the end of 2022, the city launched the “Smart Water Affairs · Urban Waterlogging Defense Project.” After rigorous surveying and modeling, the project team selected 150 high-risk waterlogging-prone sites throughout the city and fully deployed a waterlogging early warning system based on 80 GHz frequency-modulated continuous wave radar technology. During implementation, the construction team strictly followed the previously described standards for pole installation, calibration, and debugging, ensuring that the empty distance calibration errors for all 150 sites were controlled within ±5 mm. At the same time, the system used a 5G private network to achieve bottom-level data integration with the municipal emergency command center, the traffic police command and dispatch system, and the water utility group’s pump station control system.
During the defense against Typhoon Doksuri, a strong typhoon, in July 2023, the system played a decisive role. On the night of July 28, the typhoon brought extreme short-duration heavy rainfall, with rainfall intensity exceeding 100 mm/h in many urban areas. At 21:15, on the system’s large screen, data from the “Jianshe Road Underpass Tunnel” monitoring site in the city center began to rise sharply. At 21:18, the waterlogging depth exceeded 10 cm, triggering a blue warning. At 21:22, the waterlogging depth reached 22 cm, and the system automatically triggered a yellow warning, linked with the LED screen at the tunnel entrance, and issued a warning. At 21:26, the water level surged to 28 cm, triggering an orange warning.
At the instant the system triggered the orange warning, it automatically sent a linked instruction to the traffic police and activated the physical vehicle barrier gate at the tunnel entrance. Almost at the same time the barrier lowered, two passenger cars attempting to force their way through the water were successfully intercepted outside the safety line. Subsequently, the water level rapidly rose to 65 cm within 15 minutes, triggering a red warning. Because the system had predicted the situation in advance and automatically linked with the nearby No. 3 high-capacity drainage pump station, four high-power submersible pumps operated at full load, effectively curbing further deterioration of the water level.
According to post-event review data from the city’s flood prevention office, relying on this radar-based waterlogging early warning system, the flood prevention emergency response time was reduced from an average of 45 minutes under manual patrol to less than 5 minutes. During the entire typhoon period, none of the city’s 150 waterlogging-prone sites experienced any casualties caused by waterlogging, and direct economic losses from submerged vehicles decreased by approximately 85% compared with typhoons of similar level in previous years. This case fully demonstrates that the scientific and standardized installation, debugging, and maintenance of a waterlogging early warning system can transform it into a powerful digital “armor” protecting urban life and property safety.
Summary and Outlook
The construction of an urban waterlogging early warning system is an interdisciplinary systems engineering undertaking. Every detail in the implementation process—from the installation angle of the radar bracket, to the parameter settings of the filtering algorithm, to the standardized execution of routine inspections—directly affects the system’s ultimate performance during heavy rain. Ecolor Technology believes that as IoT, edge computing, and artificial intelligence technologies continue to evolve, future waterlogging early warning systems will become increasingly intelligent. For example, multi-source heterogeneous fusion technology combining machine vision, such as AI video analysis, with radar data will further reduce the false alarm rate of single sensors. Urban hydrodynamic models based on Digital Twin technology will be able to use real-time radar data to simulate waterlogging evolution trends for the next two hours. However, no matter how technology iterates, solid, standardized, and rigorous engineering practice and routine maintenance will always remain the most solid foundation for safeguarding urban flood prevention. Industry peers should continue to maintain a sense of reverence and, through professional technical standards, jointly protect urban flood prevention safety.

