Selection and Maintenance of Urban Waterlogging Early Warning Systems: How Much Does Waterlogging Monitoring Cost?
I. Introduction: From Post-Rain Response to Pre-Rain Warning
As urbanization continues, underground space expands, and extreme rainfall events occur frequently, urban waterlogging early warning has evolved from an auxiliary component of traditional flood-control systems into critical infrastructure for safe urban operations. In the past, management relied mainly on manual inspections and post-rain emergency response, often initiating action only after standing water had formed or traffic was disrupted.
In recent years, technologies such as waterlogging monitoring, radar-based rainfall measurement, intelligent video recognition, and flood-control linkage systems have been deployed at key nodes like underpasses, subway entrances, and pump stations. This marks a shift from post-event response to pre-event assessment and real-time coordination.
"Public project data shows that in some eastern cities, online monitoring coverage of flood-prone sites increased from ~18% in 2022 to 73% in 2024, with average warning lead times rising from 12 to 38 minutes."
Buyers are no longer concerned solely with equipment existence but with whether risks can be detected in advance, alarms triggered accurately, and coordinated responses initiated. The integration of sensing, communication, and platform algorithms is becoming the market mainstream.
II. Market Composition: Sensing, Transmission, Platform, and Linkage
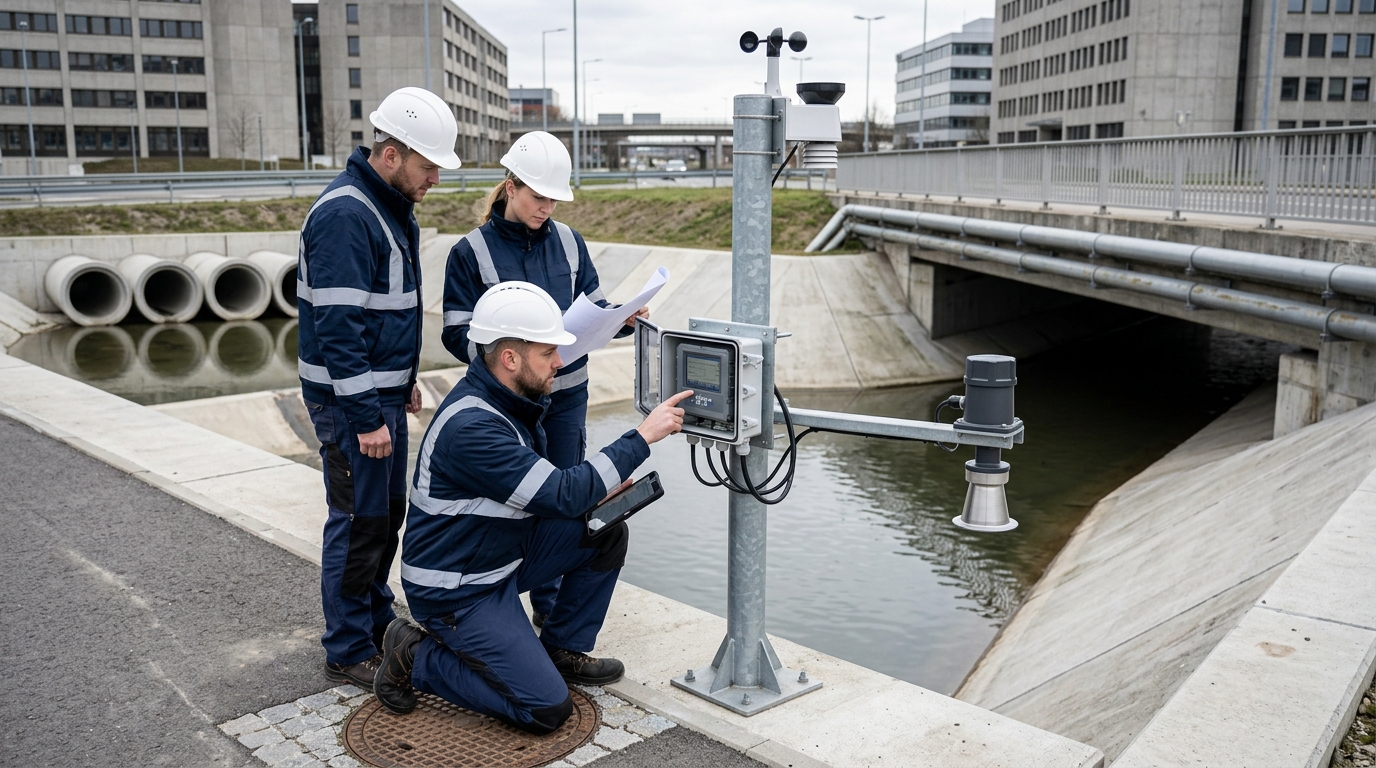
The market is composed of four layers:
- Sensing Layer: Collects data on rainfall, water level, flow, and video. Key devices include waterlogging level sensors, road radars, rain gauges, and edge computing terminals.
- Transmission Layer: Uses 4G, 5G, NB-IoT, LoRa, or fiber optics to transmit data reliably.
- Platform Layer: Assesses risk levels and triggers alarms based on algorithm models.
- Linkage Layer: Converts warnings into actions like traffic control, pump station activation, and emergency inspections.
Technically, waterlogging monitoring answers "where and how deep," while radar monitoring answers "where the rain is coming from and when it will arrive." Combining both significantly improves warning lead times compared to using either alone.
III. Product Price Ranges: Devices vs. Turnkey Systems
Prices vary widely depending on accuracy, installation environment, and platform capabilities. Below is a breakdown of typical cost ranges (in CNY):
Single-Point Devices
- Basic Terminal: ¥800 – ¥3,500/set
- Full Kit (Pole/Solar/4G): ¥2,000 – ¥8,000/set
- Contact Level Sensor: ¥1,200 – ¥5,000/set
- Non-Contact Road Radar: ¥3,000 – ¥12,000/set
- Video AI Setup: ¥3,000 – ¥12,000/site + ¥500–¥2,000/year service
Radar & Platforms
- Small Road Radar: ¥15,000 – ¥40,000/unit
- Rainfall Radar Unit: ¥800,000 – ¥2,500,000
- Networked Radar System: ¥3M – ¥8M
- District-Level Platform: ¥500,000 – ¥1,500,000
- City-Level Integrated Platform: ¥2M – ¥6M
Integrated projects typically cost more than single devices due to site-specific engineering. For example, underpass monitoring sites may range from ¥80,000 to ¥200,000 per site, while pump station sites range from ¥50,000 to ¥150,000. A medium-sized city planning 50 flood-prone sites might require a preliminary budget of ¥900,000 to ¥1,600,000.
IV. Typical Parameters and Case Studies
Urban Roads & Arterials
Requires identification of shallow standing water. Common thresholds: 3cm (advisory), 10cm (caution), 20cm (warning), 30cm (emergency). Response time should be ≤10 seconds. During heavy rain, data upload cycles shorten to <30 seconds.
Underpasses & Subway Entrances
High-risk zones requiring non-contact radar (0-200mm range, ±2mm accuracy) combined with video verification and public address systems. Field tests show these systems can identify waterlogging formation within 5-8 seconds, reducing warning time by 10-15 minutes compared to manual inspection.
Pump Stations & Drainage Outlets
Focuses on water level (±1cm accuracy), flow, and gate status. Communication via fiber optic or industrial Ethernet ensures stability during floods. Flow meters must handle impurities.
Rainfall Radar Integration
Provides trend assessment 30-60 minutes before heavy rain arrives. When combined with ground sensors, it improves local rainfall process identification accuracy by 15-20% and reduces false alarms by 10%. Note: Must be paired with drainage models to avoid misjudgments.
V. Procurement Recommendations
Avoid a one-size-fits-all approach. Classify targets by risk level:
| Risk Level | Recommended Solution | Key Considerations |
|---|---|---|
| High Risk | Non-contact radar, Video AI, Flood-control linkage | Prioritize accuracy (<10s response) and integration with traffic/emergency platforms. |
| Medium Risk | Level sensors, Basic radar, Simple rain gauges | Cost-effective solutions for general flood-prone roads and branch ditches. |
| Low Risk | Data platform inclusion only | Densify gradually based on historical rainfall events and O&M conditions. |
Sensor Selection Tips: Contact sensors are prone to sediment/trash issues on roads; non-contact radar is better for pollution resistance but requires careful installation angle. Video AI compensates for numerical limitations but struggles with night/fog/reflections. Ensure platform interfaces support MQTT, HTTP, GB28181, and WebSocket for multi-department integration.
Budget Strategy: Do not deploy low-accuracy devices over a large area. Start with 20-30 high-risk sites to form a demonstrable pilot system. Neglecting platform algorithms and long-term O&M leads to system failure in the second flood season.
VI. Maintenance Cost Analysis
Annual maintenance expenses typically account for 8% to 15% of initial construction investment. These costs are often underestimated.
Device Maintenance (Annual)
- Waterlogging Terminal: ¥300 – ¥1,500 (cleaning, battery, SIM)
- Road Radar: ¥1,000 – ¥5,000 (angle re-verification, waterproof check)
- Rainfall Radar: ¥80,000 – ¥200,000 (antenna, servo, algorithm updates)
Communication & Platform (Annual)
- Data Traffic: ¥100 – ¥500 per site (higher for video)
- District Platform: ¥50,000 – ¥300,000 (cloud, GIS, SMS)
- Project Example: 50 sites + Radar = ~¥520k - ¥580k total annual O&M
Failure rates for road devices are commonly 3-8%, while underwater sensors reach 5-10%. Main causes include sediment coverage, power supply issues, and sensor aging. Recommended practices include monthly cleaning, full calibration before/after each flood season, and maintaining 10-20% spare parts inventory.
VII. Market Assessment & Construction Path
The market is shifting from hardware sales to integrated services. While device prices fall, the value of systems with radar, AI, and linkage capabilities rises. Rainfall radar is moving from meteorological departments down to urban flood-control scenarios, becoming more compact and standardized.
Under budget constraints, a reasonable construction path involves:
- Complete flood-prone site census and risk assessment.
- Prioritize deployment at high-risk sites (underpasses, arterial roads).
- Build a unified warning platform connecting meteorological, water affairs, and transport data.
- Introduce rainfall radar and drainage models for predictive capability.
- Establish an O&M mechanism with pre-season calibration and post-season review.
Procurement Ratio Recommendation: Allocate 60-70% of budget to construction and reserve 30-40% for operation, maintenance, and algorithm optimization to prevent system shutdown due to insufficient funds.
VIII. Outlook: Toward City-Level Flood-Control Closed Loops
Future development will move beyond isolated monitoring points to city-level closed loops. Data relationships between radar (trends), ground sensors (truth), video AI (verification), and platforms (decision-making) will tighten. Urban flood control will shift from "seeing water" to "predicting water" and from single-department management to multi-department coordination.
Technologies like AI prediction, digital twins, and edge computing will further enhance capabilities. AI will predict waterlogging probability using historical and real-time data; digital twins will visualize low-lying points and networks; edge computing will reduce latency for on-site risk identification.
Ultimately, a valuable system is not just one completed before flood season, but one that continuously provides accurate, timely, and actionable risk information, translating into real resilience against extreme weather events.

