From Technical Challenges to Successful Implementation: Implementation Report on an Urban Pipeline Network Project
A comprehensive report on how a prefecture-level city in East China transformed its aging water supply network, reducing leakage from 18.7% to 12.3% through digital monitoring and proactive management.
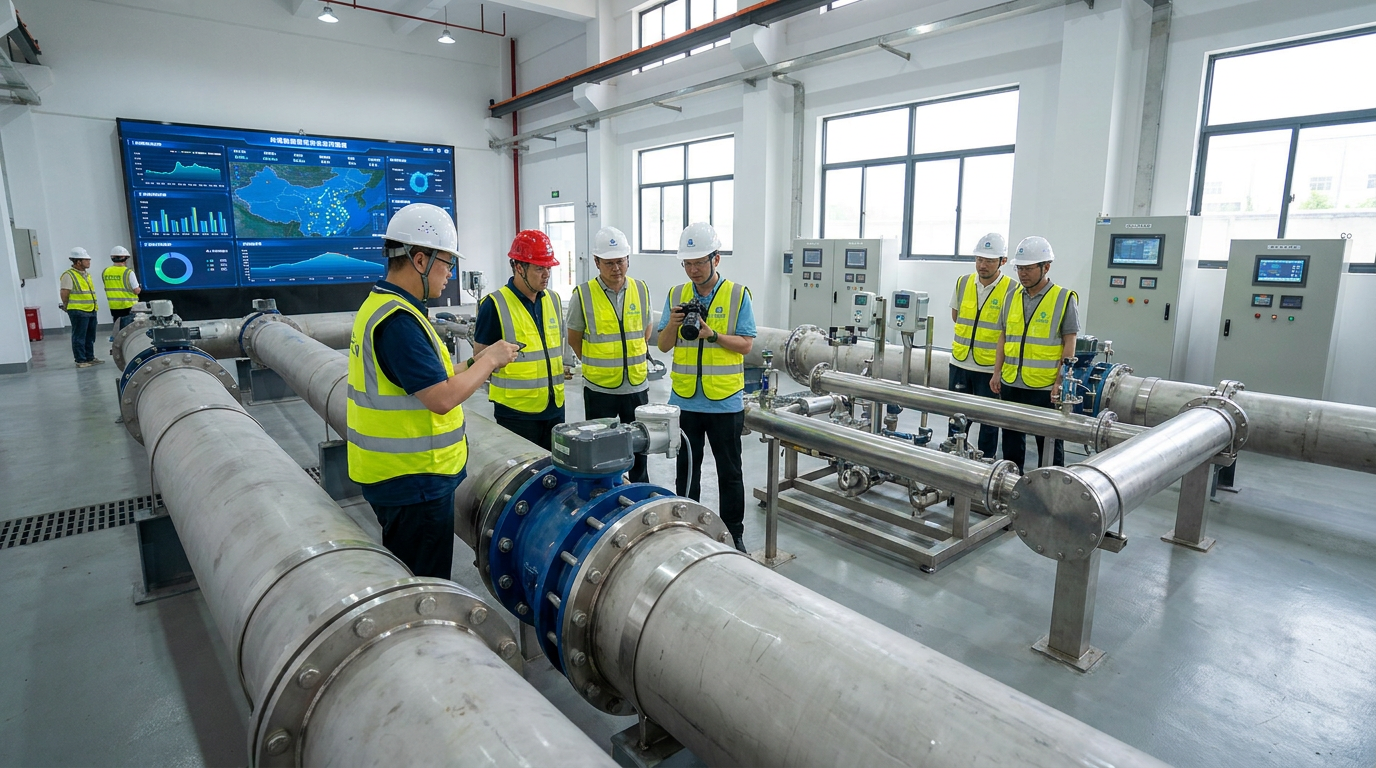
Introduction: From Passive Repair to Proactive Monitoring
From January 2024 to June 2025, a prefecture-level city in East China launched the "Water Supply Network Online Monitoring and Leakage Management Demonstration Project." Focusing on core requirements such as the water supply network, leakage analysis, pressure monitoring, and water quality safety, the project built a sensing and data analytics system covering the central urban area.
The project serves an area of approximately 142 square kilometers, with a water supply capacity of 520,000 cubic meters per day, a total network length of about 1,860 kilometers, and serves approximately 630,000 households. After 18 months of continuous operation following completion, the results were significant:
Leakage Rate
Decreased from 18.7% to 12.3%
Non-Revenue Water
Dropped from 21.4% to 15.8%
Pressure Compliance
Increased from 92.3% to 98.6%
Water Quality
Compliance rate remained above 99.95%
This case provides a referenceable engineering sample for the digital and refined operation of aging urban water supply networks.
I. Project Background: Pressures Compounded by Aging
The central urban area has a permanent population of approximately 2.18 million. The construction of the water supply network spans over 30 years, with pipe diameters ranging from DN80 to DN1600. According to the asset census prior to the project launch, the average pipe age is about 17.8 years, and aging pipe sections in operation for over 20 years total approximately 486 kilometers.
Prior to the project launch, the city's water supply system faced three prominent issues:
- High Leakage: Annual leakage volume was approximately 28.4 million cubic meters (18.7% leakage rate).
- Uneven Pressure: Significant terrain fluctuations caused low pressure (<0.14 MPa) in high-elevation areas during peaks and high pressure (>0.38 MPa) in low-lying areas at night.
- Insufficient Water Quality Stability: Issues with secondary water supply facilities and dead-end pipes led to complaints of yellow water and turbidity.
II. Technical Challenges: Hidden Leaks & Data Fragmentation
Technical assessments revealed four main challenges:
- Incomplete Network Data: Early paper-based drawings led to missing coordinates and attributes in the GIS system (12.6% incomplete), making DMA delineation difficult.
- Weak Leakage Signals: High background noise from traffic and industry interfered with acoustic detection, while small-flow hidden leaks were hard to locate manually.
- Complex Pressure Conditions: Coupling relationships among multiple water sources and frequent pressure transients induced joint leakage and pipe fatigue.
- Fragmented Data: SCADA, revenue, inspection, and hotline systems operated separately, resulting in inconsistent data standards and siloed information.
III. Solutions: Synergistic System Architecture
The project adopted a roadmap of "DMA metering + online sensing + model analysis + closed-loop handling."
DMA Zoning Structure
The city was divided into a three-tier DMA structure: 18 primary districts, 25 secondary districts, and 33 tertiary districts, forming 76 independently metered units covering 92.4% of the service area.
Sensing Layer Deployment
Flow Measurement
98 electromagnetic flow meters (DN100-DN1200)
Pressure Monitoring
216 points covering outlets, mains, and extremities
Water Quality
45 multi-parameter monitors (turbidity, chlorine, pH)
Noise Detection
320 pipeline noise terminals for hidden leak identification
Key Data Governance Goal: Establish "unified coordinates, unified time, and unified indicators" to prevent new data silos.
IV. Implementation Process: Four Phases
(3 Months)
Pipeline Census & DMA Optimization
Verified 1,860 km of pipelines, corrected 2,380 valve locations, and supplemented 47,000 pieces of attribute data.
(4 Months)
Pilot Verification
Selected 12 high-risk DMAs. Validated the process: online alarm → work order dispatch → on-site verification → feedback.
(6 Months)
Full-Area Deployment
Completed equipment installation for remaining 64 DMAs. Improved online rate from 87.4% to 98.2% using external antennas and solar power.
(5 Months)
Model Optimization
Established leakage risk scoring models incorporating pipe age, material, and historical bursts to generate monthly inspection lists.
V. Leakage Analysis: Locating Real Losses
Using DMAs as units, the platform calculates minimum night flow daily. Taking a tertiary DMA in the northern urban area as an example:
- Pre-renovation: Minimum night flow was 34.6 m³/h.
- Action: Platform issued alerts for five consecutive days. Noise monitoring and correlator detection locked the leak to a DN200 PE pipe joint.
- Result: Post-repair, minimum night flow dropped to 6.8 m³/h, saving ~19,000 m³ monthly.
Pressure optimization also played a key role. By setting thresholds in 32 high-risk areas, the system identified 218 over-pressure periods. Average nighttime pressure in pilot areas decreased from 0.33 MPa to 0.28 MPa, reducing seepage expansion risks.
VI. Pressure & Water Quality Monitoring
Pressure Control
The platform generated pressure heatmaps every 15 minutes. In a high-elevation residential community, adjusting regional pressure reducing valves stabilized pressure between 0.20 and 0.24 MPa, reducing low-pressure complaints from 41 to 9 per month.
Water Quality Response
During summer 2025, residual chlorine at network extremities dropped to 0.12 mg/L. The platform triggered a warning, prompting operators to flush a 3.2-kilometer DN150 branch pipe within 4 hours. Residual chlorine recovered to 0.32 mg/L, preventing large-scale incidents.
VII. Final Results: Impact & ROI
As of December 2025, after 18 months of stable operation, the project achieved significant improvements:
Financial Benefits
- Annual leakage reduction: ~9.2 million m³
- Direct cost savings: ~19.3 million RMB/year
- Static investment payback period: ~3.6 years
Operational Efficiency
- Leak confirmation time: 48h → 8h
- Proactive detection cycle: 12mo → 3mo
- Pipe burst incidents (DN300+): 9 → 3 annually
- Low-pressure complaints: ↓ 61.9%
The water supply enterprise successfully shifted from "repairing upon receiving complaints" to "proactive handling based on data," forming a closed-loop management mechanism.
VIII. Conclusion and Outlook
This project demonstrates that effective water supply network monitoring requires integrating assets, operational data, leakage models, and business processes. For cities with aging networks and complex terrain, this pathway offers strong replicability.
Looking ahead, the city plans to expand noise monitoring, establish pipeline remaining life assessment models, and incorporate secondary water supply and fire hydrants into unified regulation. As sensing costs decline and algorithms mature, the underground water network will transform from a "hidden project" into a quantifiable, predictable, and optimizable urban infrastructure asset.

