From Technical Challenges to Successful Implementation: A Case Study of an Urban Pipeline Network Project
Engineering Case Study: Shifting from Reactive Burst Repair to Proactive Sensing in Water Distribution Networks
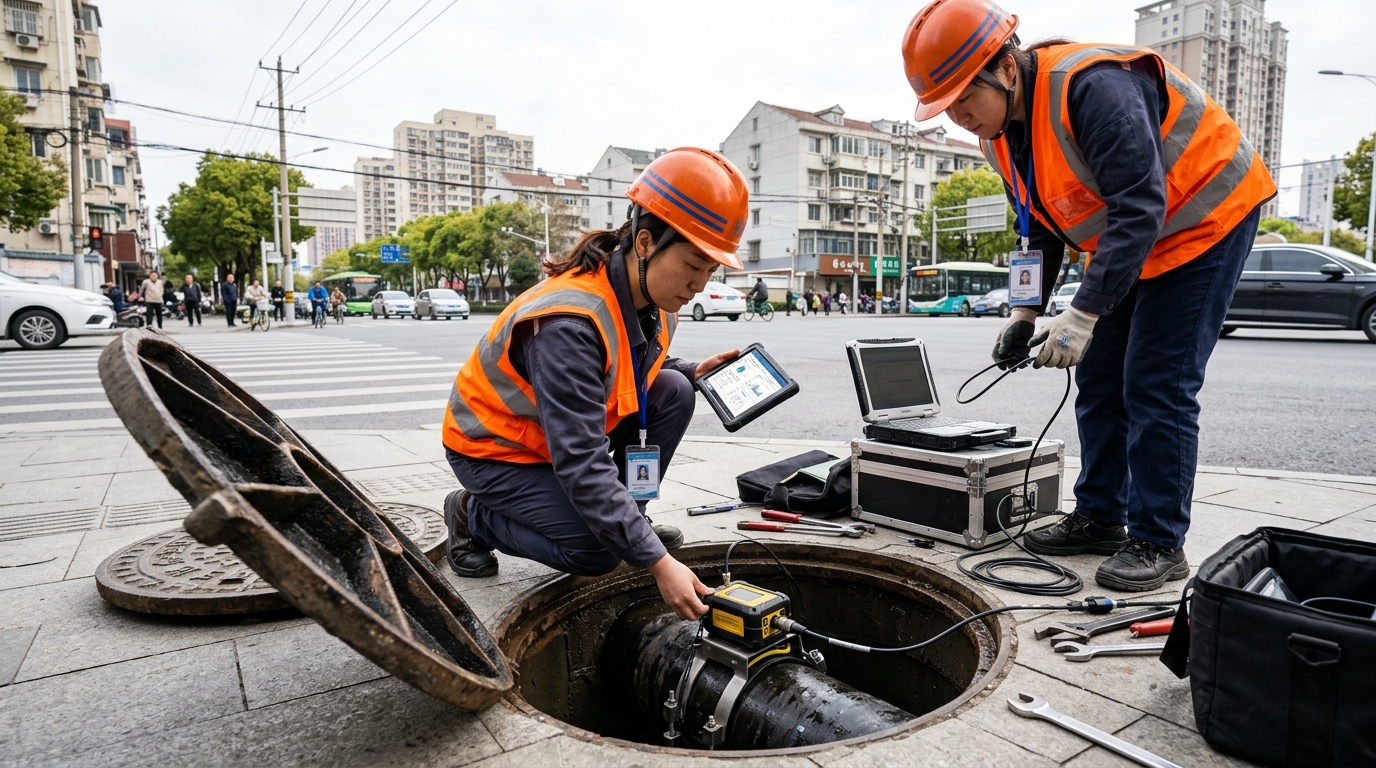
Introduction: The Shift to Data-Driven Governance
In March 2024, the water distribution network leakage control and water quality safety monitoring project for a major urban area completed overall acceptance. This extensive project covers approximately 380 square kilometers of service area, involving 1,260 kilometers of municipal pipelines, serving a population of about 820,000 people with an average daily supply volume of 240,000 m³.
The infrastructure deployed includes 186 District Metered Areas (DMAs), 1,240 pressure monitoring terminals, 96 electromagnetic flow meters, 78 multi-parameter online water quality analyzers, 42 noise recorders, and 310 smart valve-pit monitoring nodes. These components form an integrated system linking network status, leakage analysis, pressure monitoring, and water quality safety.
"Acceptance data showed that the leakage rate decreased from 16.8% to 8.3%, burst response time shortened from 142 minutes to 37 minutes, and water quality anomaly detection time dropped from 6.5 hours to 22 minutes."
This engineering practice demonstrates a critical shift: urban water management is moving from a reactive mode dominated by manual inspection and burst repair to a proactive governance mode centered on real-time early warning and district-based management.
Project Background: Compounded Aging Risks
The city’s water supply system began construction in the 1980s. Gray cast iron, galvanized steel, and early concrete pipes account for about 42% of the trunk network, with some sections exceeding 30 years of service. As urban expansion increased high-rise demand, pressure imbalances emerged. Preliminary surveys revealed average pressures of 0.31 MPa, but peak-hour zones dropped below 0.22 MPa while low zones spiked above 0.45 MPa at night.
Traditional management relied heavily on repair requests and post-event handling, resulting in late detection and fragmented responses. From 2022 to 2023, the area recorded 214 burst and leakage events, with hidden leaks accounting for 61% and an average detection cycle of 12.7 days. Water utilities urgently needed a quantifiable, traceable operations system to address these unsustainable challenges.
Technical Challenges: Beyond Simple Instrumentation
Water distribution network monitoring is a complex systems engineering effort. The project faced five core technical hurdles:
- Incomplete Basic Data: Early verification found 18% of pipe segments had coordinate deviations >3 meters, and 9% of valve statuses were inconsistent with asset records.
- Complex DMA Boundaries: Loop networks and unregistered connections caused flow cross-over, distorting water balance calculations.
- Leakage Location Difficulty: Hidden leaks lack external traces. Noise recorders often suffered interference from traffic and construction, with correlation errors reaching 30–80 meters.
- Multi-Parameter Coordination: Distinguishing between a pressure drop caused by a burst versus peak demand, or residual chlorine decline due to aging versus secondary contamination, required sophisticated logic.
- Field Communication Constraints: Many monitoring points were in basements or green belts with weak 4G/NB-IoT signals and difficult power access, necessitating low-power acquisition and resume-on-reconnect transmission strategies.
Solution: The Four-Layer Architecture
To address these challenges, the project adopted a robust four-layer architecture: Sensing — Transmission — Model — Application.
Sensing & Transmission Layer
Deployed pressure transmitters, flow meters, and water quality analyzers prioritized at trunk nodes and high-risk areas. Used NB-IoT, 4G, and LoRa hybrid networking with wired backups for critical pump stations to ensure data upload success rates.
Model & Application Layer
Built a hydraulic model integrating SCADA, GIS, and billing data. Applications include leakage analysis using DMA night minimum flow, pressure monitoring with 0.05 MPa alarm thresholds, and dynamic water quality warnings based on multi-parameter deviations.
A closed-loop mechanism was established: "Monitoring—Alarm—Dispatch—Handling—Review." All events entered the work-order system, and handling results were written back to the model to optimize subsequent alarm rules, reducing false positives over time.
Implementation: Phased Calibration Strategy
The 16-month implementation cycle was divided into five distinct phases:
- Network Census: Re-surveyed 1,260 km of pipelines, updated 236,000 segment attributes, and verified 310 valve pits.
- DMA Zoning: Divided the area into 186 DMAs (covering 15k–25k people each) with clear boundaries for easy maintenance.
- Platform Integration: Connected 1,240 pressure terminals and resolved relay configurations in 17 weak-signal areas.
- Hydraulic Model Calibration: Calibrated parameters using historical data, keeping pressure error within ±0.02 MPa and flow error within ±5%.
- Trial Operation: Conducted 60 days of alarm testing, reducing the false alarm rate from 18.4% to below 8.3%.
System Capabilities: Precision and Performance
The engineering value lies in high-frequency data capture and system stability. Pressure terminals sample every 5 minutes (increasing to 1 minute at critical nodes), while noise recorders automatically boost sensitivity between 23:00 and 05:00. The platform processes ~2.8 million records daily, supporting second-level queries for recent data and trend analysis for historical data.
Key Performance Metrics
- Average latency from device upload to work-order generation: 42 seconds
- DMA night minimum flow calculation completion: < 10 minutes
- Device online rate stability: > 97.2%
The leakage analysis module identifies abnormal districts via water balance, distinguishes bursts via pressure/flow changes, and narrows locations using noise records. Simultaneously, the water quality module performs joint assessments of residual chlorine, turbidity, pH, conductivity, and temperature to avoid single-indicator false alarms.
Engineering Case: Coordinated Leak Detection
In November 2023, a DMA in Zone B showed a night minimum flow increase from 12.4 m³/h to 41.7 m³/h, triggering a level-2 leakage warning. Pressure monitoring confirmed a drop from 0.33 MPa to 0.29 MPa. No obvious burst noise was detected, suggesting a hidden leak.
The platform linked water quality data, revealing a decrease in residual chlorine (0.08 mg/L) and an increase in turbidity (1.2 NTU) downstream, indicating potential external ingress. Field teams used leak listening and valve isolation to locate a joint leakage 1.8 meters beneath a road green belt, with a 22 mm opening.
Outcome: The event took 5 hours and 18 minutes from alarm to location and 7 hours to repair, saving ~2,600 m³ of water. Under traditional methods, this hidden leak could have persisted for weeks.
Final Results and Future Outlook
After one year of operation, the project achieved significant metrics improvements:
(from 16.8%)
(from 142 min)
(from 6.5 hours)
Pressure stability improved significantly, with low-pressure zones during peak hours decreasing from 11.4% to 4.2%. Secondary water supply facility anomaly handling efficiency improved by 65%. Crucially, the project transformed management culture: inspections are now data-driven, repairs are proactive, and operational analysis is backed by multi-source evidence.
Looking ahead, the city plans to expand monitoring to suburban industrial parks and integrate with urban waterlogging and emergency dispatch systems. This case proves that synergistic capabilities across sensing, transmission, and modeling are essential for modern, refined urban water supply operations.

