Complete Guide to Installation and Commissioning of Water Supply Network Monitoring Systems
Shifting from Reactive Emergency Repair to Proactive Diagnosis
1. Introduction: The Shift in Water Supply Management
As urban water supply scales expand, network service life increases, and users demand greater stability and continuity, management strategies are evolving. The industry is moving away from primarily manual inspection and reactive emergency repair toward online monitoring, data analysis, and proactive diagnosis.
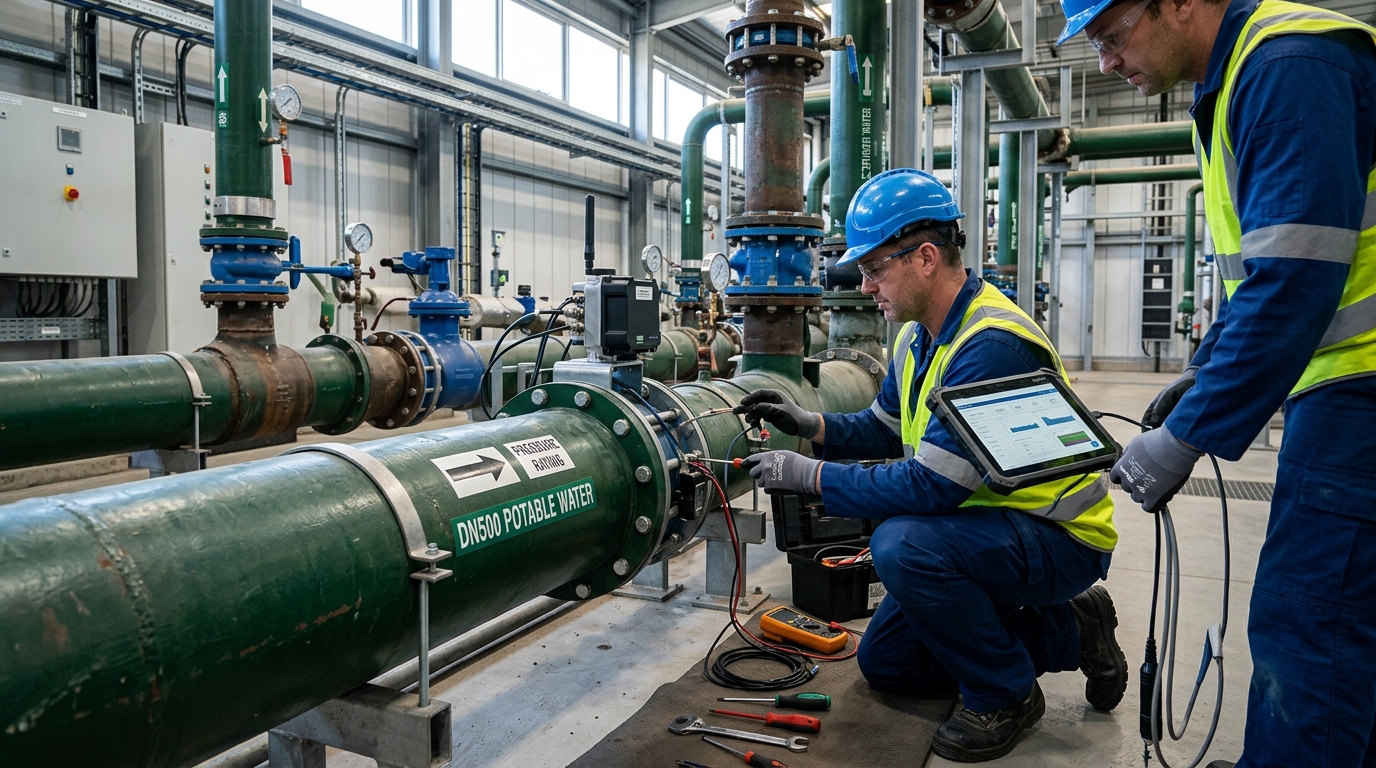
This guide focuses on four key pillars: water supply networks, leakage analysis, pressure monitoring, and water quality. It is designed for utility operations, maintenance teams, secondary water supply managers, and smart water implementation personnel. Below, we provide practical steps for installation, commissioning, routine maintenance, and troubleshooting.
Note: Parameters and cases cited here illustrate practical principles. Specific projects must be designed according to pipe diameter, pressure rating, site conditions, local standards, and company procedures.
2. Monitoring System and Site Layout Principles
A comprehensive water supply network monitoring system typically consists of four components:
- Pressure Monitoring: Assesses network status, burst risk, and night pressure control.
- Flow Measurement: Tracks zone total volume, user consumption, and leakage accounting.
- Online Water Quality: Continuously monitors residual chlorine, turbidity, pH, and conductivity.
- Leakage Analysis: Identifies background and burst leaks via DMA zoning, night minimum flow, and pressure gradients.
Site Layout Strategy
Layouts should cover trunk nodes, zone boundaries, large users, high/low points, secondary facilities, schools, and hospitals. Avoid placing sensors only in newly built areas while ignoring older networks.
Pressure Sensor Specs
- Range: 0–1.0 MPa or 0–1.6 MPa (based on design pressure).
- Accuracy: Better than 0.5% FS.
- Sampling: 1–5 minutes.
- Protection: Minimum IP68 for outdoor devices.
- Spacing: Every 5–10 km on DN300+ mains; every 1–2 km on DN100–DN200 branches.
Flow & Quality Specs
- Electromagnetic Flowmeters: Applicable to DN150–DN400+. Accuracy ±1%–±2%. Requires 5D upstream / 3D downstream straight pipe runs.
- Water Quality Points: Plant outlet, network endpoints, secondary tanks/pump stations.
- Sampling Interval: 15–60 minutes depending on process variability.
3. Installation Steps: Field Operations
Pre-Installation Preparation
Long-term data stability relies on preparation. Verify drawings, outage plans, valve locations, chamber conditions, and signal strength. Prepare isolation valves, tees, gaskets, grounding materials, PTFE tape, portable gauges, and calibration records. Ensure all instruments have factory certificates and confirmed battery/power status. Flush branch pipes in old networks to prevent debris entry.
Pressure Terminal Installation
Use tees with service valves or test ports (DN15–DN25 branch).
- Close upstream valve; confirm depressurization.
- Install isolation/drain valves and connect transmitter/gauge.
- Slowly open valve; vent air; check for leaks.
Avoid: Air pocket accumulation points, strong vibration near pumps, and low-point sediment zones. Reserve a 20–30% safety margin in the range. Implement lightning protection and drainage measures for chambers.
Flow Terminal Installation
Key requirements are full pipe and reliable grounding. Install where the pipe is full, avoiding negative pressure after pumps or half-closed valves. For flanged connections, tighten bolts diagonally and ensure gaskets do not protrude into the pipe. The sensor housing and grounding ring must be equipotential with the pipe to prevent zero drift. After filling slowly and venting air, perform zero calibration and full-scale comparison.
Water Quality Terminal Installation
Typically uses bypass sampling. Draw a branch from the main pipe with filtration, pressure reduction, and flow control valves. Maintain sensor chamber velocity at 0.2–1.0 m/s to avoid dead zones.
- Residual Chlorine: Amperometric or colorimetric.
- Turbidity: Keep optical windows clean.
- pH/Conductivity: Ensure temperature compensation.
Chambers need drainage, ventilation, and reagent access. In secondary supply systems, sample at tank outlets or after booster pumps to reflect actual user-end quality.
4. Commissioning Methods: Ensuring Reliable Data
Commissioning occurs in three stages: field single-point, platform integration, and continuous operation acceptance.
Stage 1: Field Single-Point Commissioning
- Pressure: Compare with portable gauges. Error within 0.5% FS. Record static (valve closed) and dynamic (valve open) pressures.
- Flow: Check full pipe status, grounding resistance, and zero output. Compare with portable meters. Error within ±2% for DN200; ±1%–1.5% for DN400+.
- Quality: Calibrate with standard solutions (pH 2/3-point, DPD for chlorine, Formazin for turbidity). Record dates and validity.
Stage 2: Communication Platform Integration
Standardize device IDs, locations, ranges, and thresholds. Time synchronization is critical; use NTP/platform sync to prevent misalignment in night minimum flow and burst localization analyses. Set outlier filtering rules (e.g., negative flow, pH outside 0–14).
Stage 3: Continuous Operation Acceptance
Run for at least 72 hours. Data completeness should exceed 98%. Critical alarms must push to O&M personnel within specified time limits. Documentation includes point layouts, equipment lists, calibration records, and communication tests.
5. Leakage Analysis Practice
Core principle: Divide large networks into measurable, comparable DMA units. Create four ledgers: total flow, pressure status, night minimum flow (NMF), and user meter readings.
Night Minimum Flow (NMF)
Measured typically between 2:00 AM and 4:00 AM. Units: m³/h/km.
- Well-managed networks: Background leakage NMF controlled at 0.5–2 m³/h/km.
- Investigation trigger: If NMF exceeds 2–3 m³/h/km, initiate investigation.
Case Study: Burst Localization
Scenario: A mid-sized city DMA with 12,000 households, DN400 trunk, 6 pressure nodes, and 1 boundary flow meter.
Detection: Over two weeks, NMF rose from 1.6 to 3.4 m³/h. Two adjacent pressure nodes showed abnormal differences (0.03–0.05 MPa) at night.
Action: Ruled out large-user consumption/meter anomalies. Used pressure gradient to narrow scope. Combined acoustic leak detector and correlator to locate a DN200 bell-and-spigot joint leak.
Result: Post-repair NMF dropped to 1.7 m³/h. Zone leakage rate decreased from ~18% to ~12%.
Burst Pipe Monitoring Rules
Common alarm thresholds:
- Pressure drop > 0.08 MPa within 5 minutes.
- Sudden flow increase > 30%.
- Short-term turbidity rise > 2–5 NTU.
- Abnormal decrease in residual chlorine.
Emergency procedure: Confirmation → Isolation → Localization → Repair → Flushing → Disinfection → Restoration. Acoustic correlators achieve 100–300 m error on metal pipes; accuracy decreases on concrete/old pipes, requiring combined judgment with valve chambers and geology.
6. Water Quality Monitoring Practice
Focus on disinfection continuity, sensory indicators, and contamination risk. Routine indicators include residual chlorine, turbidity, pH, conductivity, and temperature.
| Indicator | Target/Limit | Online Range/Accuracy |
|---|---|---|
| Free Residual Chlorine | ≥ 0.3 mg/L (Plant Outlet) ≥ 0.05 mg/L (Endpoint) |
0–5 mg/L Acc: 0.05 mg/L |
| Turbidity | ≤ 1 NTU (General) | 0–100 NTU Acc: ±0.1 NTU or ±2% FS |
| pH | 6.5 – 8.5 | 0–14 Acc: 0.01 |
| Conductivity | Process Dependent | 0–2000 μS/cm |
Handling Abnormalities
Adopt a tiered procedure:
- Low Residual Chlorine: Check chlorination system, sensor, and residence time.
- High Turbidity: Investigate bursts, flushing, construction, tank contamination, or hydraulic disturbance.
- High Conductivity: Alert for industrial connections, backflow, or material anomalies.
- pH Changes: Check sensor aging, reagent contamination, or dosing issues.
Case Insight: Endpoint data showed chlorine dropping to 0.02 mg/L and turbidity rising to 1.8 NTU. Investigation revealed a secondary tank uncleaned for >12 months. After cleaning and disinfection, chlorine recovered to 0.18 mg/L and turbidity dropped to 0.4 NTU. Monitoring must extend beyond plant outlets to secondary and user-end points.
7. Routine Maintenance and Fault Troubleshooting
Maintenance Schedule
- Pressure Terminals: Inspect monthly; increase frequency during rain, heat, or freezing.
- Flow Terminals: Check zero point, full pipe status, and grounding monthly.
- Water Quality: Calibrate pH monthly; clean/replace chlorine probes/reagents every 2–4 weeks; wipe turbidity windows monthly; check sampling branches for blockage.
- Batteries: Replace every 1–2 years (life shortened by cold/frequent comms).
- Chambers: Inspect seals, drainage, lightning grounding, and fixation.
⚠️ Safety Warning: Confined Space Work
Always ventilate first. Test for oxygen, hydrogen sulfide, and methane. Implement an attendant system. Never enter chambers blindly.
Troubleshooting Common Faults
Missing Data
Check voltage, battery, SIM, heartbeat, antenna, module, and interface.
Abnormal Pressure
Check blocked branches, half-closed valves, unvented air, wrong range, or zero drift.
Abnormal Flow
Confirm full pipe, air entrainment, grounding reliability, electrode fouling, or non-full-flow install.
Data Drift (Quality)
Check electrode aging, expired standards, temp compensation, bubbles, window fouling, reagents, velocity.
For false leakage alarms, rule out large-user night consumption, meter reading anomalies, valve leaks, pressure fluctuations, delays, and time desynchronization. Always record cause, measures, restoration time, and observation period for a closed loop.
8. Closing Outlook: Intelligent Diagnosis Closed Loop
The next stage is not just adding devices, but integrating pressure, flow, quality, leakage analysis, and work orders into a closed-loop system. Future advancements will combine hydraulic models, digital twins, and AI algorithms to predict bursts, leakage trends, and quality fluctuations.
Utilities should proceed in this order:
- First DMA, then full network.
- First pressure and flow, then deeper water quality.
- First alarms, then closed-loop work orders.
Only by standardizing installation, commissioning, calibration, inspection, and troubleshooting can monitoring truly serve leakage control, water quality assurance, and supply security.

