In-Depth Comparison of Four Monitoring Technology Approaches for Water Supply Pipe Networks
Comparative Review of Water Supply Network Monitoring Technology Roadmaps: Selection Reference for Pressure, Leakage Analysis, and Online Water Quality Monitoring
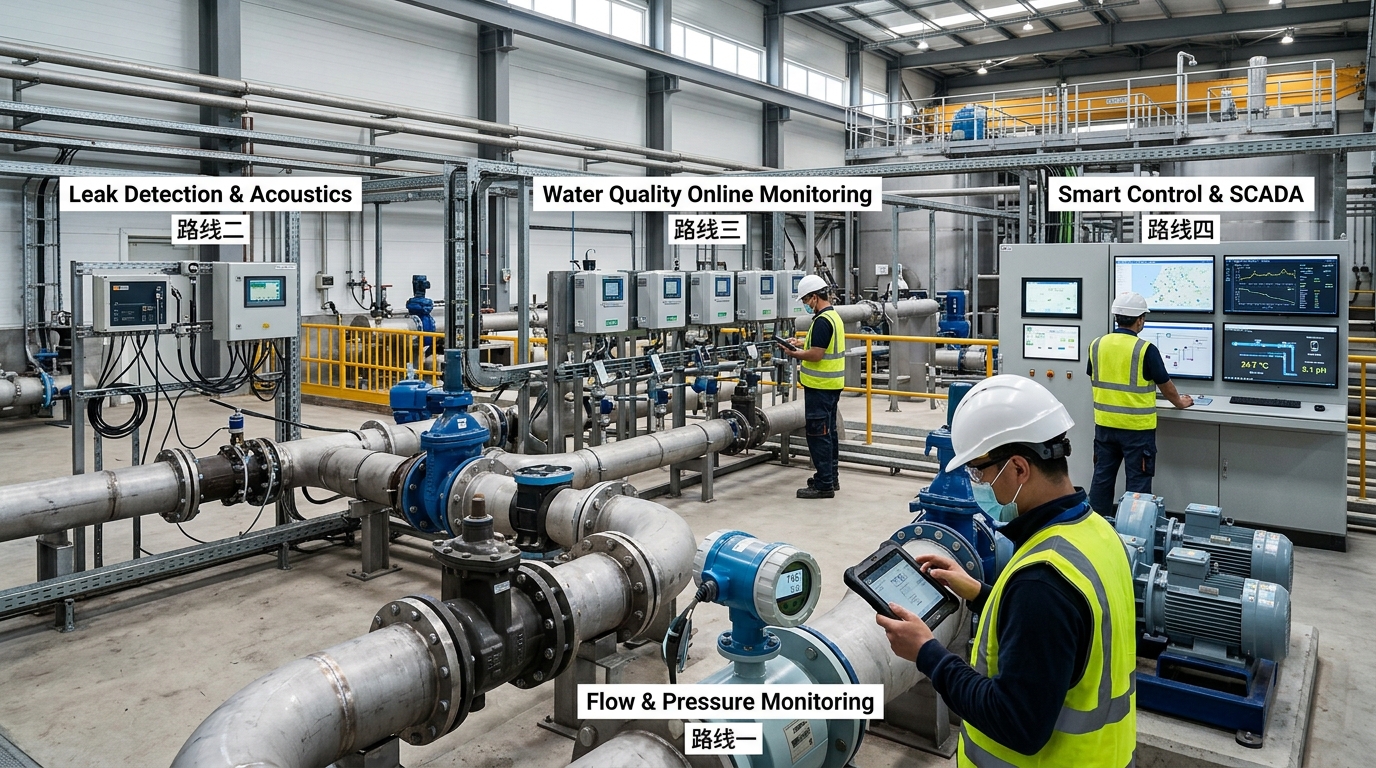
The water supply network is a fundamental lifeline for urban operation, and its safe, stable, and efficient performance directly affects residential water use, industrial production, and urban emergency response capability. As networks expand, service life increases, secondary water supply facilities become more complex, and users demand higher water quality safety, water supply network monitoring has gradually shifted from the traditional “emergency repair after pipe bursts” to end-to-end management involving “condition sensing, leakage analysis, pressure regulation, and water quality early warning.”
Different monitoring technology roadmaps vary significantly in cost, accuracy, deployment difficulty, applicable scenarios, and data value. Focusing on core keywords such as water supply networks, leakage analysis, pressure monitoring, and water quality, this article objectively compares technical approaches including manual inspection, SCADA and DMA district metering, acoustic leak localization, distributed fiber-optic sensing and space-airborne inspection, online water quality monitoring, and communications and platform architecture, and provides phased selection recommendations.
I. Monitoring Objectives and Indicator System
Water supply network monitoring must first establish a clear indicator system. Pressure monitoring typically focuses on node pressure, zone pressure, nighttime pressure fluctuations, and sudden pressure drops before and after pipe bursts. Typical operating pressures range from 0.2 to 0.6 MPa; local nodes in aging networks may fall below 0.15 MPa or exceed 0.8 MPa. Pressure sensor accuracy is generally selectable as 0.5%FS or 0.25%FS; high-risk nodes may use 0.1%FS. Note that pressure data alone cannot directly determine leakage locations; it must be combined with flow, acoustic, GIS, and hydraulic model data.
Leakage Analysis Indicators
- Network Leakage Rate: Difference between supplied and sold water volume.
- NRW Rate: Non-revenue water percentage.
- Night Minimum Flow (NMF): Low-consumption period (2:00–4:00 a.m.) analysis.
- Anomaly Threshold: NMF exceeding baseline by 20–50% indicates hidden leaks or unauthorized use.
Water Quality Indicators
- Routine: Residual chlorine, turbidity, pH, conductivity.
- Advanced: Dissolved oxygen, ammonia nitrogen, nitrate, TOC.
- Standards: End-point residual chlorine ≥ 0.05 mg/L; Plant outlet 0.3–0.8 mg/L.
- Accuracy: Turbidity ~0.1 NTU; pH ~0.01; Conductivity ~1 μS/cm.
II. Manual Inspection and Periodic Leak Detection
Manual inspection is the most traditional approach, relying on leak detection rods, electronic detectors, and experience-based judgment. Its advantages are low initial investment and flexibility, suitable for small systems with limited budgets. A single inspection can cover 5 to 15 km of network. However, efficiency drops significantly in dense networks with numerous valve chambers.
"Manual inspection supports only reactive emergency repairs and cannot meet the refined requirements of modern water supply networks for continuous leakage analysis and water quality early warning."
While effective for shallow-buried metal pipes (localization error 1–3 m), it struggles with deep-buried plastic pipes (PVC/PE) and noisy environments. Case studies show that while leakage rates may drop slightly (e.g., 16% to 13%), hidden leaks and minor seepage often remain undetected due to long cycles and discrete data. Therefore, manual inspection is best used as an auxiliary measure alongside online monitoring.
III. SCADA and DMA District Metering
SCADA and DMA represent the mature foundational layer of monitoring. SCADA integrates field instruments, RTUs, and communication networks for online data collection. DMA divides large networks into measurable zones using boundary valves and meters to identify leakage and analyze abnormal usage.
Key Configuration Parameters
- Flow Meters: DN50 to DN800, accuracy ±1% to ±2%.
- Pressure Sensors: Accuracy 0.25%FS or 0.1%FS.
- Data Interval: Pressure acquisition every 1–15 minutes.
- DMA Size: Typically serves 3,000–10,000 customers or covers 5–30 km.
Case Study: A second-tier city project deployed 320 DMA zones, 4,500 pressure points, and 1,200 flow meters. After 18 months, leakage rate dropped from 18.6% to 11.3%, and burst detection time shortened from 72 hours to 12 hours.
Shortcomings include high upfront investment and O&M complexity. Boundary valve leaks or metering errors can cause false judgments in night minimum flow analysis. Furthermore, SCADA/DMA provides zone-level clues but does not directly locate leaks; acoustic tools are still required for precise pinpointing.
IV. Acoustic Noise Loggers and Correlators
Acoustic monitoring is the primary technology for leak localization. Noise loggers installed on hydrants or valves collect background noise during nighttime low-consumption periods. Suspected leaks are identified via spectral analysis or AI classification. Correlators use two sensors at either end of a pipe segment to calculate location based on time-difference-of-arrival of sound waves.
Localization Accuracy
(Correlators)
Applicable Pipe Segment Length
Metal pipes offer better acoustic propagation than plastic/PVC/PE pipes, where sound attenuates rapidly. Case Study: An industrial park deployed 180 noise loggers over 60 km. By analyzing 10 days of nighttime data, 14 suspected leaks were screened with an average localization error of 1.2 m. Leakage rate dropped from 15% to 9%.
Challenges include battery life (3–8 years), installation coordination, and interference from traffic/pump noise. Acoustic monitoring is rarely independent; it acts as a precise tool following SCADA/DMA anomaly detection.
V. Fiber Optics, Satellites, and Drones
Distributed Fiber-Optic Sensing: Optical fibers laid along trunk mains act as continuous sensors for strain, temperature, and vibration. This allows for meter-level localization over several kilometers. It is ideal for high-risk segments like river-crossings or tunnels but lacks economic viability for dispersed urban networks.
Space-Airborne Inspection: Satellite InSAR monitors ground settlement (centimeter-level accuracy) to predict pipe stress risks. Drones provide wide-area coverage using thermal and visible light imaging to detect surface wetness or structural anomalies. These technologies are best for risk assessment and post-disaster surveys rather than direct minor leak identification.
Practical Application Loop: Wide-area screening (Satellite/Drone) → Focused verification (GIS/Hydraulic Model) → On-site localization (Acoustic/Fiber).
VI. Online Water Quality Monitoring
Moving from laboratory sampling to online sensors enables minute-level continuity. Common intervals are 5–30 minutes, shortening to 1–5 minutes at critical nodes. This detects residual chlorine decay, turbidity spikes, and contamination events in secondary supply systems promptly.
Technical Challenges: Sensor maintenance is rigorous. Residual chlorine electrodes require regular cleaning; turbidity sensors are affected by bubbles/biofilm; pH electrodes drift. Data credibility depends on calibration mechanisms.
Selection Strategy: Full deployment is costly. A hierarchical approach is recommended: install online instruments at critical nodes (plants, secondary pumps, sensitive areas like hospitals) and combine with manual sampling for smaller, stable networks. Always correlate water quality data with pressure/flow events (e.g., restarts causing sediment resuspension).
VII. Communications, Power, and Data Platforms
Sustainable operation relies on robust infrastructure.
| Technology | Best Use Case | Key Characteristics |
|---|---|---|
| NB-IoT | Dispersed pressure gauges, small flow meters | Low power, 5–10 yr battery, 1–3 km coverage |
| LoRaWAN | Private networks, parks, county-level | Gateway radius 1–10 km, penetration issues in underground |
| 4G/5G | Video, edge computing, high-bandwidth stations | Stable, scalable, higher power/data cost |
| Fiber Optic | Trunk nodes, plants, dispatch centers | High reliability, high construction/O&M cost |
Data Platform Importance: Platforms must integrate GIS, SCADA, DMA, and hydraulic models. Edge computing gateways are crucial for underground chambers, storing 7–30 days of data locally to backfill transmission during outages. Focus should shift from visualization dashboards to data quality, alarm closed loops, and O&M efficiency.
VIII. Selection Recommendations & Future Outlook
There is no single optimal solution. Selection must balance scale, risk, budget, and O&M capability.
Small Systems / Budget-Limited
Start with manual inspection + critical-node NB-IoT pressure monitoring. Suitable for networks < 200 km, leakage < 12%. Focus on record completion and standardized procedures.
Medium Urban Systems
Adopt DMA district metering + Night Minimum Flow analysis + Focused Acoustic Monitoring. Suitable for networks 200–1,000 km. Shift from reactive repair to proactive leakage control.
Large Cities / Industrial Parks
Build multi-technology integration: SCADA/DMA foundation + Acoustic localization + Distributed Fiber/Online Water Quality + Satellite/Drone assessment. Requires coordinated GIS, hydraulic models, and professional O&M teams.
Future Trends: Development toward Digital Twins, AI-driven leak detection, and low-cost sensing. Successful projects rely not on the number of devices, but on reliable data quality, complete O&M closed loops, and technology approaches precisely matched to specific network problems.

