Carbon Emission Monitoring Routine Maintenance and Troubleshooting Manual
Introduction: Under dual-carbon management and supply-chain disclosure pressures, more and more enterprises are shifting carbon emission accounting from annual static reports to process-oriented, online monitoring. Yicai Technology's industry editor has observed that the real implementation challenges lie not in equipment selection, but in whether installation, commissioning, maintenance, and troubleshooting are standardized.
Carbon emission monitoring supports carbon accounting, carbon footprint, and greenhouse gas management, and requires measuring instruments, data links, boundary rules, and audit trails to work together. This guide uses manufacturing plants and park energy stations as examples and provides a practical implementation path.

1. First, Define the Boundary: Carbon Emission Monitoring Is Not Just a Single-Device Issue
Enterprises must first define the monitoring scope. Greenhouse gases typically include carbon dioxide, methane, nitrous oxide, and others, but most factories focus on carbon dioxide for online monitoring while also recording fuel consumption, electricity, steam, compressed air, and material measurements. Carbon accounting boundaries are generally divided into Scope 1 direct emissions, Scope 2 energy-related indirect emissions, and Scope 3 value-chain emissions. Online monitoring can directly support Scope 1 stationary combustion sources and process emissions, and can also support Scope 2 through electricity meters, gas meters, and steam flow meters. Scope 3 relies more on supply-chain activity data and life cycle assessment, and cannot be resolved solely by plant equipment.
In practice, an “emission source inventory” should be established. For example, common emission sources at an automotive parts company include natural gas boilers, paint drying ovens, air compressors, diesel generators, chillers, canteen gas, and process emissions. Each emission source should specify its measurement method: online flue gas monitoring, fuel meters, electricity meters, material balance, or estimation models. Once the inventory is defined, subsequent installation points, data fields, calibration records, and carbon accounting formulas must remain consistent to avoid double counting or omissions.
The core output of carbon emission monitoring is not instantaneous concentration, but mass emission rate. A common formula is: Emission = flue gas flow × CO2 concentration × density correction × operating time, followed by verification against fuel carbon content, oxidation rate, or emission factors. If only CO2 concentration is monitored without reliable flow, temperature, pressure, and humidity data, it is difficult to produce credible carbon accounting results. Therefore, the installation plan must simultaneously incorporate concentration, flow, operating-condition parameters, and activity data.
2. Installation Steps: Sampling Points, Hardware, Metering, and Data Links
Step 1: Sampling-Point Selection
Flue gas sampling ports should be located where velocity is stable, mixing is uniform, and vortices and dead zones are avoided. Engineering experience typically requires at least 3 pipe diameters of straight pipe upstream of the sampling point, preferably 5 diameters under ideal conditions, and at least 1 diameter downstream. Avoid elbows, reducers, downstream of valves, and areas near burner outlets. For small-diameter flues, if straight-pipe requirements cannot be met, multi-point grid sampling or flow straighteners should be used.
Step 2: Hardware Deployment
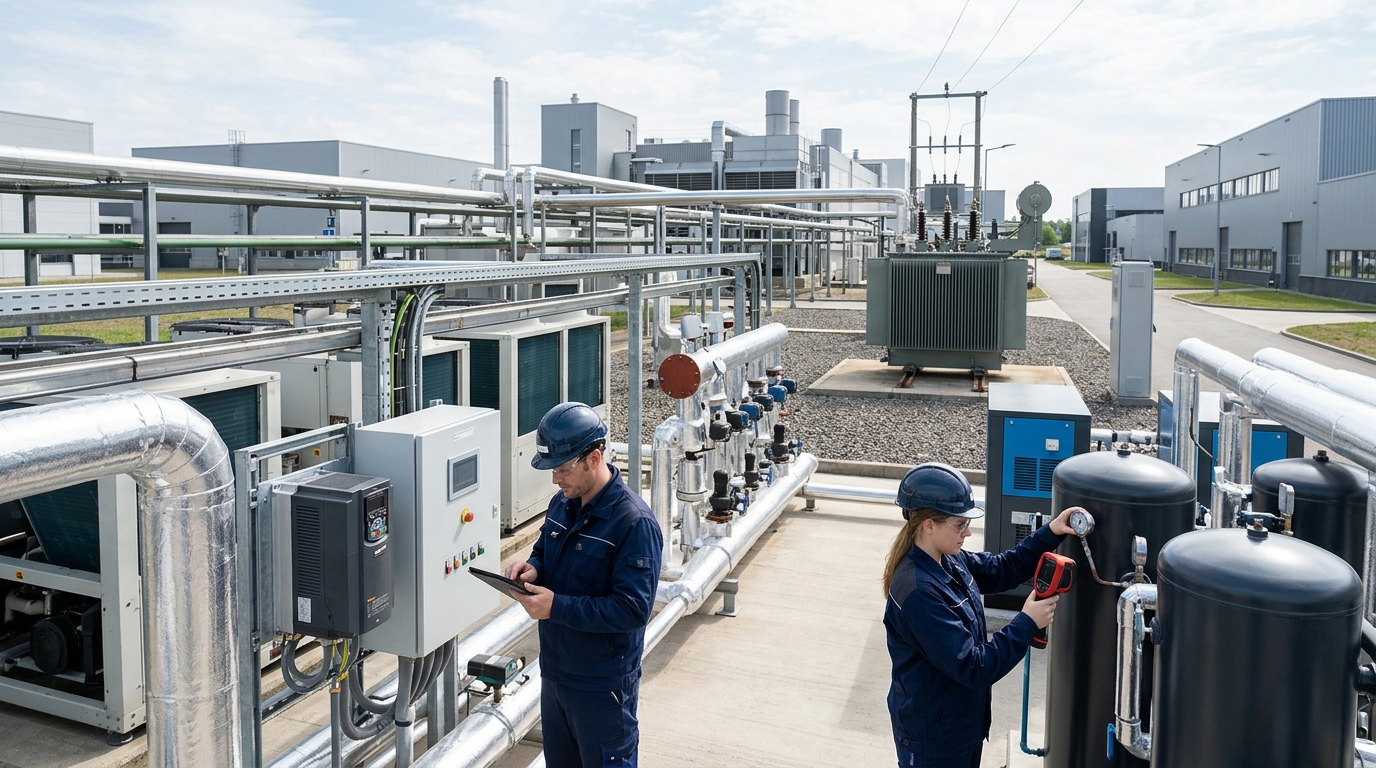
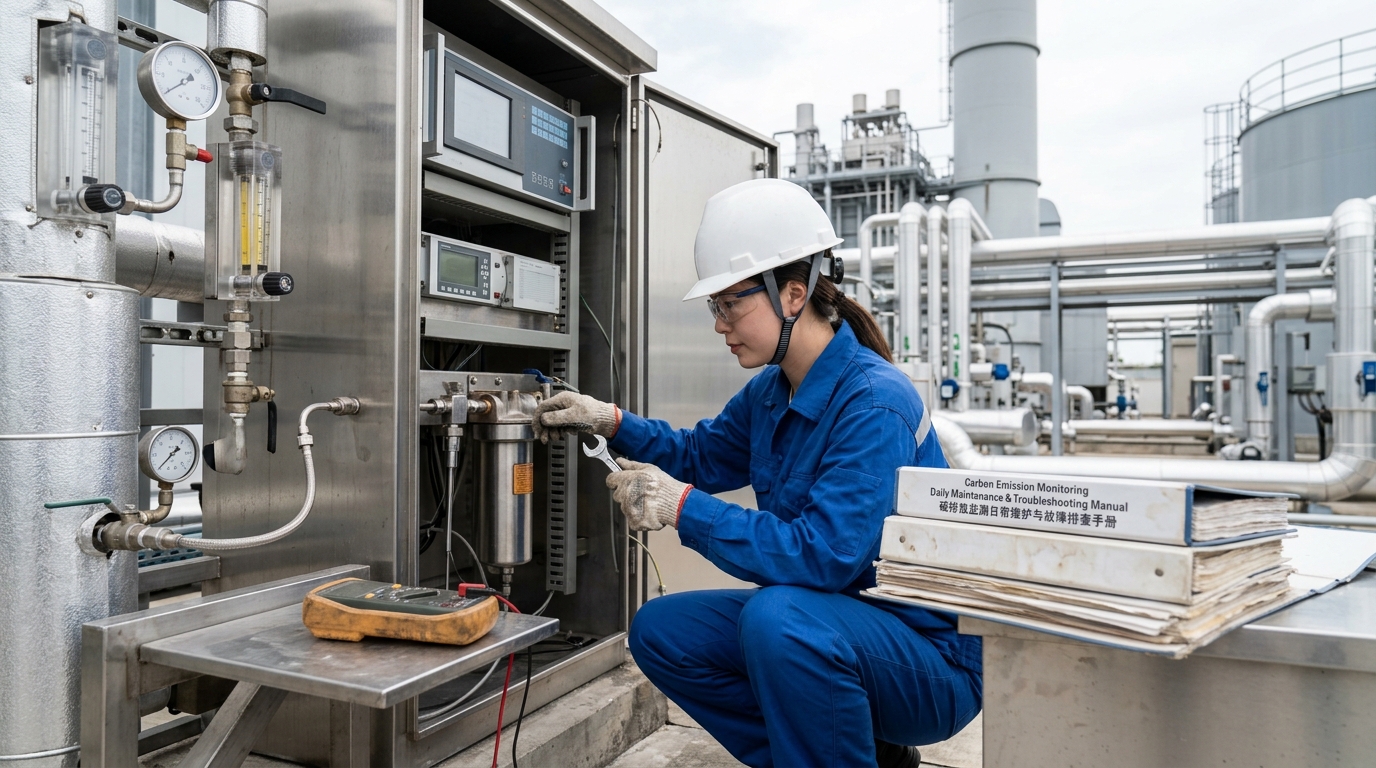
A typical online flue gas monitoring system includes a sampling probe, heated lines, filters, sampling pump, dehydration unit, analyzer, calibration unit, and data acquisition unit. CO2 is commonly measured by NDIR; O2 by zirconia or paramagnetic methods. Heated-line temperature is generally controlled between 120 °C and 160 °C to prevent condensation interference.

Step 3: Installation of Measuring Instruments
Carbon accounting depends not only on flue gas analyzers, but also on fuel consumption and activity data. Natural gas should be measured by mass flow meters or verified volumetric flow meters with temperature and pressure corrections. Electricity metering should use smart meters with communication interfaces (sampling interval ≤ 1 minute). Steam systems should preferably use vortex shedding or orifice flow meters with simultaneous temperature and pressure compensation. All measuring instruments should be included in a register with verification cycle, range, accuracy class, and installation location clearly marked.
Step 4: Data Link and Security Protection
Field devices connect to data acquisition gateways via RS485, Ethernet, 4G/5G, or industrial buses (Modbus TCP, OPC UA, MQTT). Gateways should provide time synchronization, local buffering, and breakpoint resume functions. On the server side, configure database partitioning, backup strategies, and access permissions. For combustible gas areas, ensure explosion-proof ratings for pumps and cabinets. Grounding, lightning protection, rain protection, and high-temperature protection must be completed during construction.
3. Commissioning Methods: Calibration, Integration, and Alignment
Commissioning is not simply “power on and start reading data.” First, zero calibration and span calibration should be performed. Zero calibration can use high-purity nitrogen or zero gas; span gas should cover the commonly used range (e.g., CO2: 5%, 10%, 15%; O2: 20.9% air; NOx/SO2: 50, 150, 300 ppm gradients). Carbon accounting scenarios usually require at least one automatic calibration per week, one manual verification per month, and one full linearity check per quarter.
- Operating-Condition Parameter Integration: Flue gas flow can be measured by pitot tube, ultrasonic, or differential pressure methods. Perform a velocity profile test to confirm sampling-point representativeness. Temperature, pressure, humidity, and oxygen content must be used for standard-condition conversion.
- Response Time Verification: The sampling system from intake to output should generally meet T90 of less than 60 to 120 seconds. Fast response helps prevent data distortion during startup and shutdown for intermittent equipment.
- Carbon Accounting Boundary Alignment: Establish “cross-checks” during commissioning. Estimate CO2 emissions by multiplying natural gas consumption by carbon content and compare with online flue gas monitoring results. Calculate heat using steam flow, temperature, and pressure, and match it with gas consumption. Use electricity meter data to calculate Scope 2 emissions. Investigate deviations rather than modifying reports.

4. Daily Maintenance: Frequency, Records, and Quality Indicators
| Frequency | Key Tasks |
|---|---|
| Daily | Check data completeness, alarms, sampling pressure, heated-line temp, pump status, communication link. Log continuous 2-hour data loss or drift. |
| Weekly | Check probe blockage, filter contamination, condensate discharge, and calibration gas cylinder remaining level. |
| Monthly | Clean sampling lines, replace filter elements, inspect pump diaphragms/solenoid valves, perform zero and span calibration. |
| Quarterly | System-level linearity calibration, flow-device comparison, spot checks of measuring instruments. |
| Annual | Support third-party verification, performance acceptance, and carbon accounting audits. |
Maintenance records are key evidence for credible monitoring. Enterprises should retain calibration certificates, standard gas batches, maintenance logs, exception handling tickets, software upgrade records, data backup logs, and third-party comparison reports. Auditors review processes, not just results. Any event affecting emission data—including equipment failure, sampling interruption, boundary adjustment, or instrument replacement—must have a timestamp, responsible person, and recovery measures.
Recommended Quality Indicators
- Data Completeness Rate: Target ≥ 95% (calculated hourly).
- Valid Data Rate: Target ≥ 90% (excluding faults, calibration periods, outliers).
- Calibration Deviation: Zero/span drift < 1-2% of full scale.
- Maintenance Timeliness: Measured by planned work orders completion.
5. Common Troubleshooting: Locating Root Causes from Symptoms
Concentration Drift
Flow Anomaly
Data Loss / Comm Interrupt
Carbon Accounting Deviation
6. Case Study: Remediation Process After Deployment
An automotive parts enterprise had annual GHG emissions of ~86,000 tCO2e. Main sources: natural gas boilers, paint drying ovens, air compressors, steam system. Initially, they installed only CO2/O2 analyzers in boiler flues plus electricity/gas meters. Three months later, flue-gas converted emissions were 12% lower than gas-meter accounting, and audits requested supplementary records.
Identified Issues & Remediation:
- Sampling Port Location: Located 1.5 pipe diameters downstream of an elbow (insufficient representativeness).
Fix: Reopened port with 5 pipe diameters upstream straight pipe; added multi-point flow measurement. - Gas Meter Correction: No temperature/pressure correction applied, causing low winter readings.
Fix: Connected gas meter to temperature and pressure compensation systems. - Boundary Gaps: Steam condensate recovery and venting not included in activity data.
Fix: Added flow meters and recovery-volume records to steam system. - Calibration Frequency: Monthly was too infrequent.
Fix: Adjusted to weekly automatic calibration and monthly manual verification.
After remediation, continuous monitoring for 90 days showed deviation decreased from 12% to 3.5%, hourly data completeness increased from 88% to 96.8%, and valid data rate exceeded 92%. The company formed an evidence chain using on-site monitoring, energy ledgers, and calibration records for supply-chain disclosure, identifying about 8% energy-saving potential in the paint drying process.
This case shows that the value of online monitoring is not merely having data, but making data explainable, traceable, and auditable.
7. Closing Outlook: Credible Monitoring Will Become Carbon Management Infrastructure
Future carbon emission monitoring will show three trends:
- Detailed Standards & Audit Requirements: Companies must provide measurement boundaries, equipment status, calibration records, and data quality indicators, not just totals.
- System Integration: Online monitoring will integrate with energy management, production execution, and equipment maintenance systems. Anomalies will pinpoint specific furnace heats, shifts, or equipment.
- Supply Chain Extension: Product carbon footprints will extend from single companies to supply chains, requiring standardized data interfaces and third-party verification mechanisms.
For enterprises, the key to practical carbon emission monitoring is to form a closed loop across installation, commissioning, maintenance, and troubleshooting.
Related Product: Hero V9 EC60 Data Acquisition Terminal — Ecolor Hero V9 EC60 Data Acquisition Terminal — data logging and remote telemetry for energy and carbon emission monitoring.