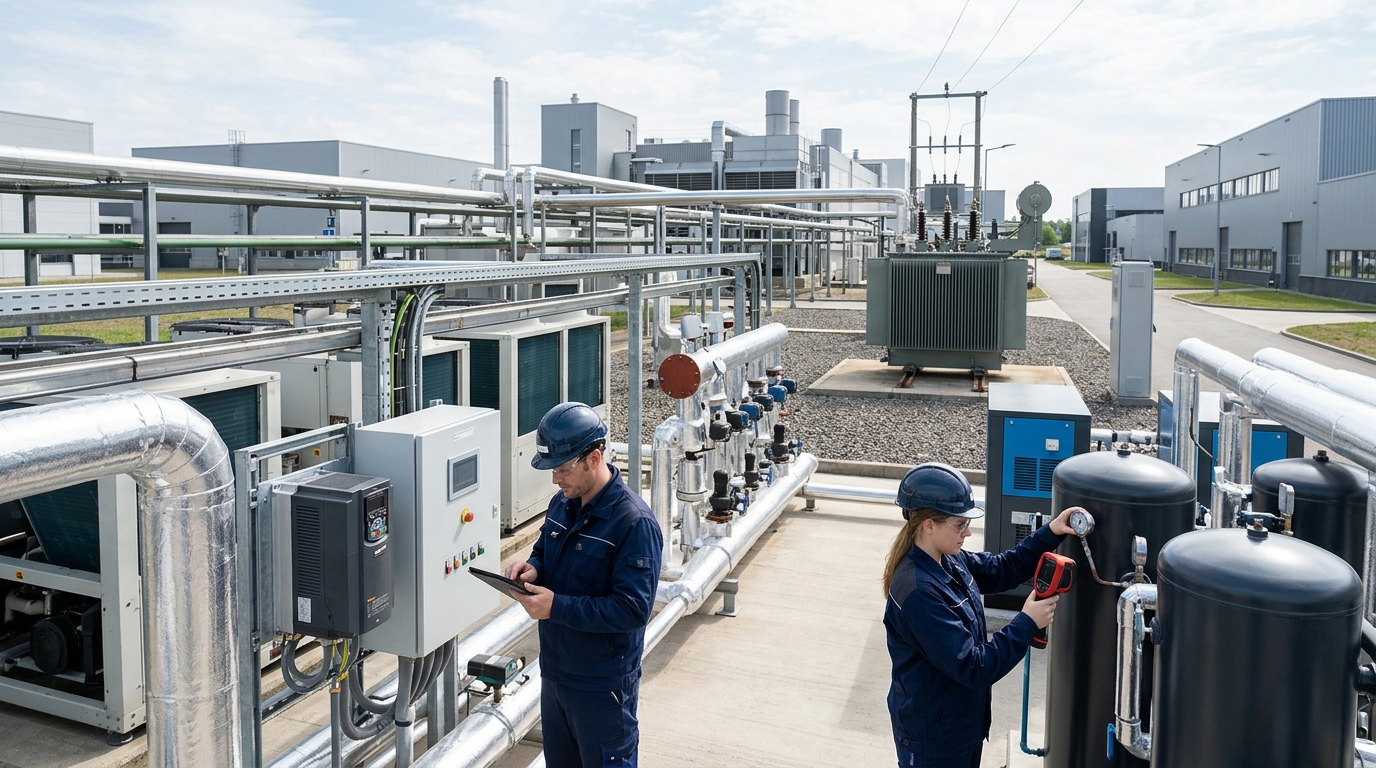
Return on Investment Analysis for Carbon Emission Monitoring: Cost-Benefit Comparison in Smart Water Management Projects
As carbon peaking and neutrality goals advance globally, the focus of carbon emission monitoring is shifting from "whether to do it" to "how to do it accurately, manage it effectively, and control costs." This article analyzes the market structure, technical routes, and long-term investment returns.
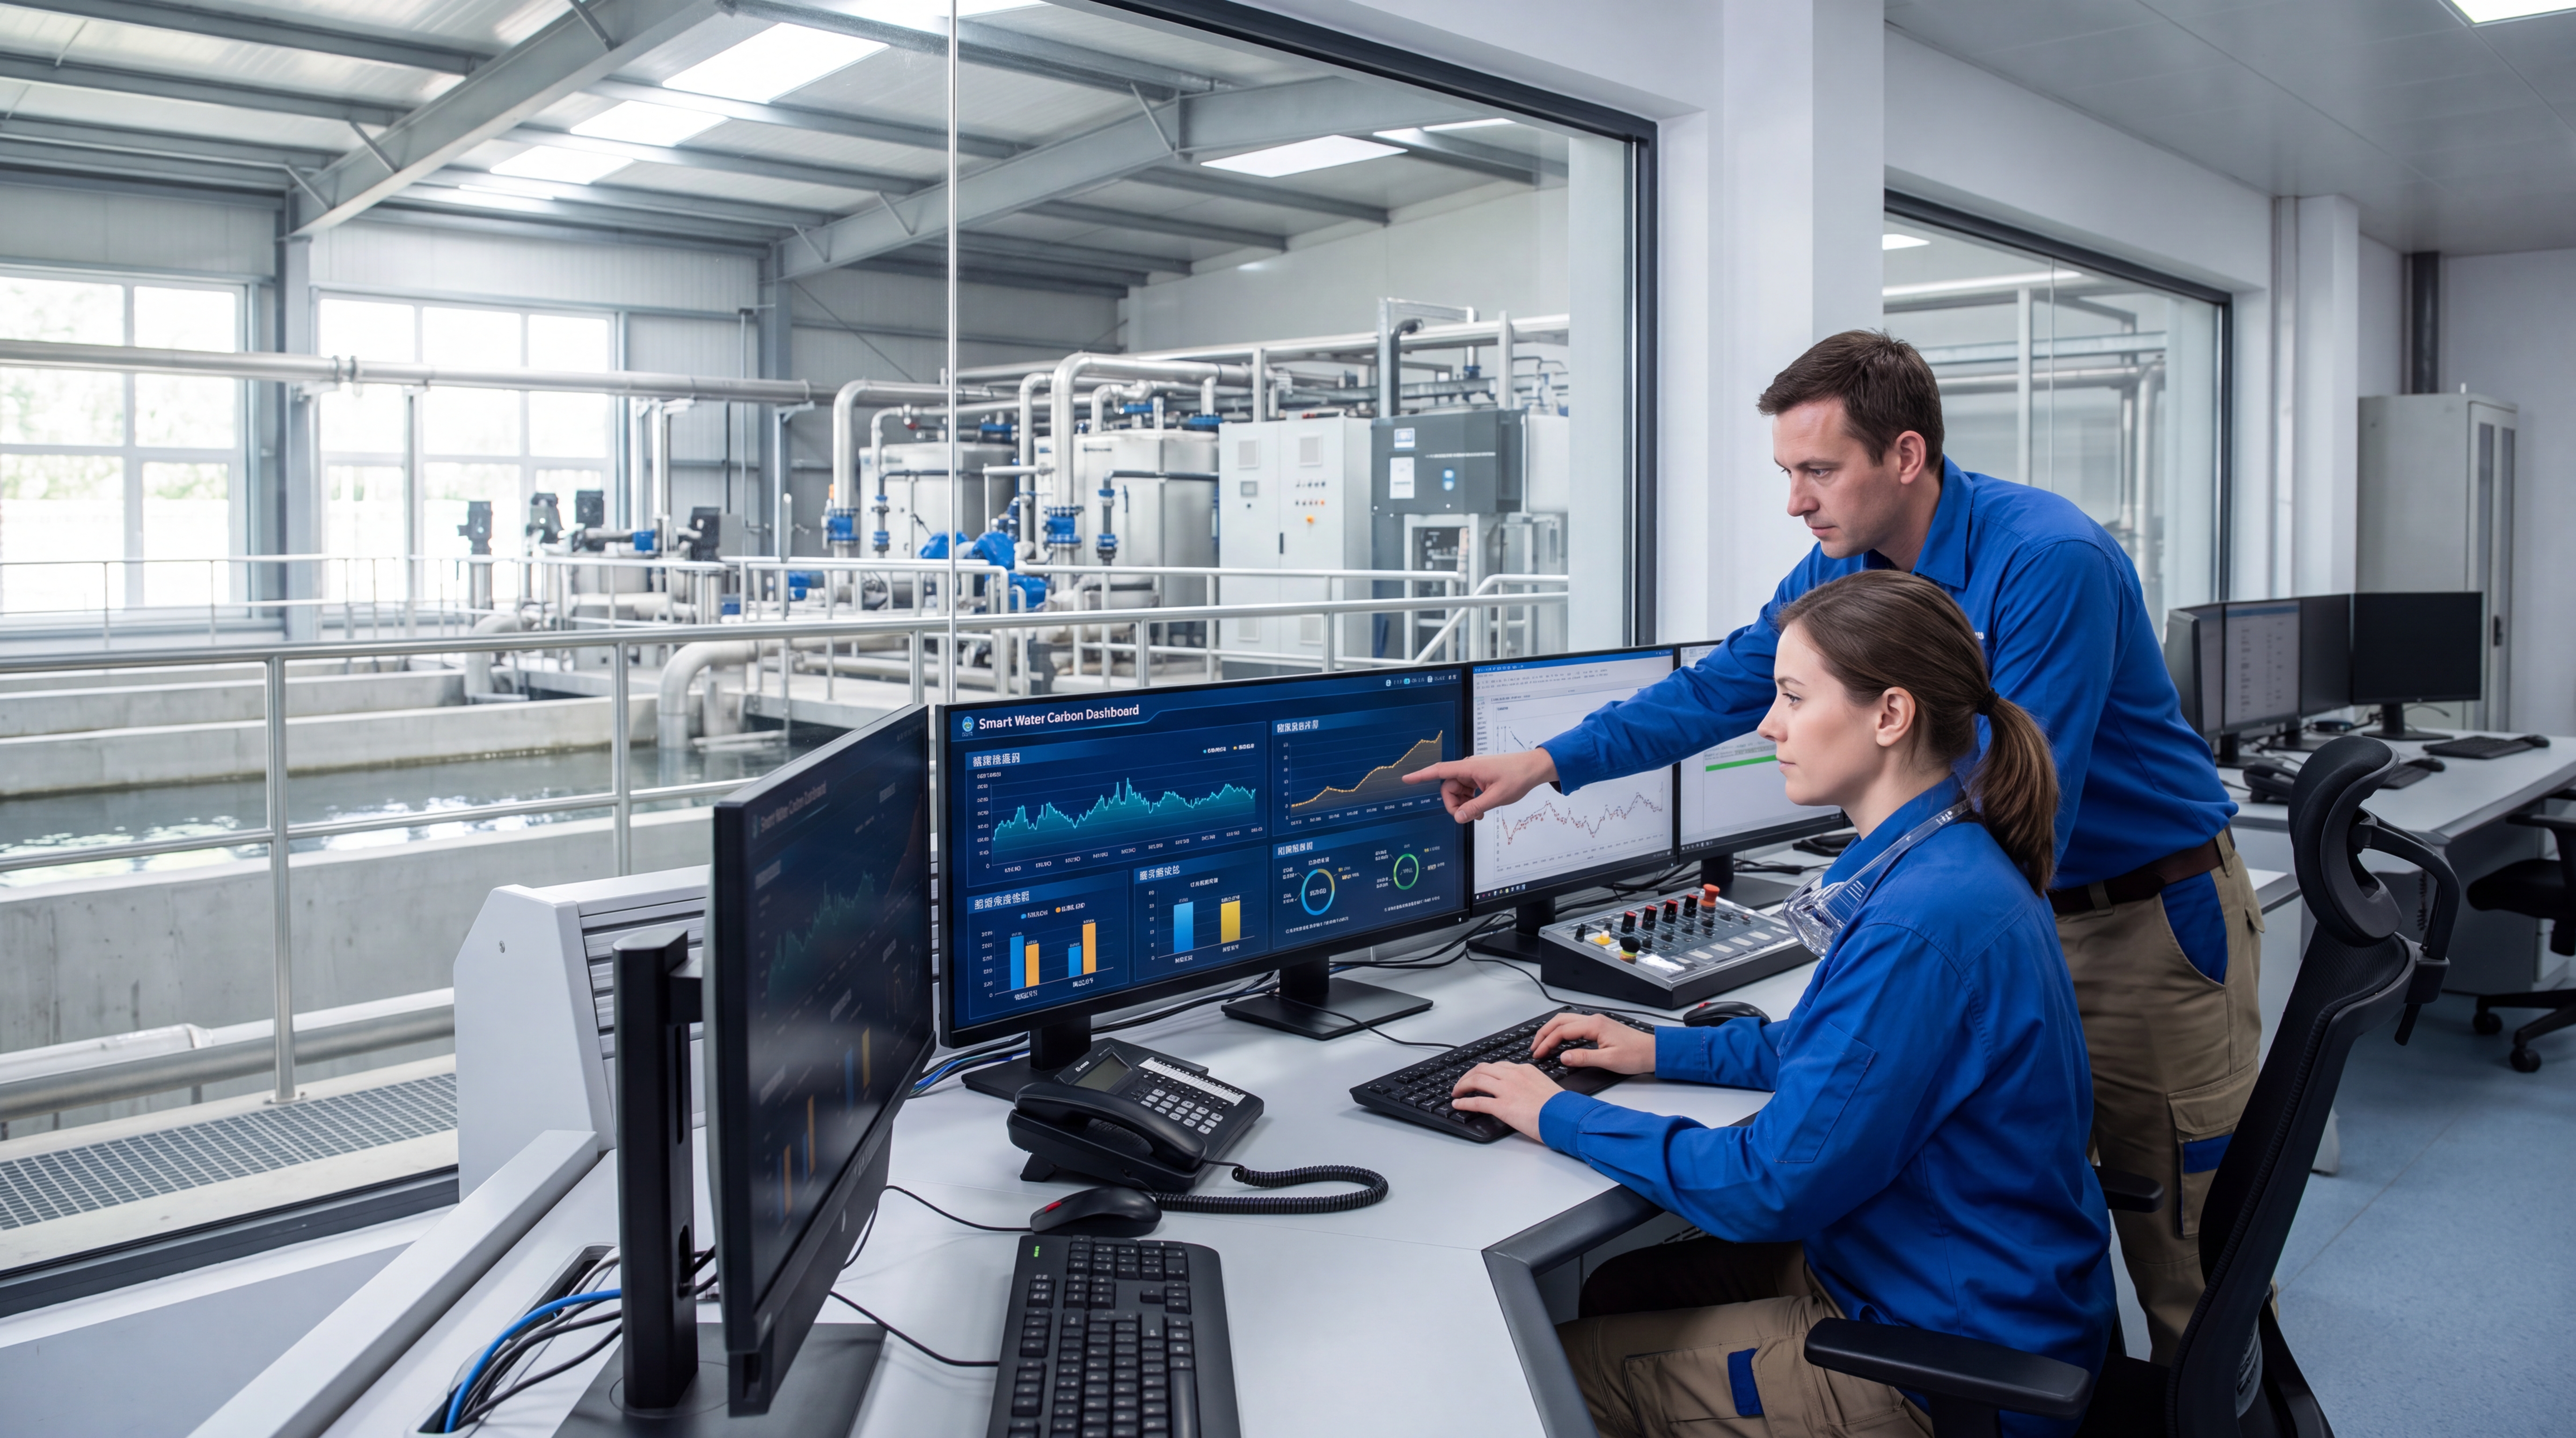
Introduction: The Shift to Data Quality and Cost Efficiency
In the past, corporate carbon management primarily focused on annual accounting and reporting. Today, with the expansion of carbon markets, elevated low-carbon requirements across supply chains, and stricter environmental information disclosure, keywords such as carbon accounting, carbon footprint, and online greenhouse gas monitoring have become high-frequency topics in industrial, energy, park, and urban management sectors.
From a market perspective, carbon emission monitoring is no longer just about procuring a single piece of equipment; it encompasses a comprehensive system that includes measuring instruments, online monitoring equipment, data acquisition systems, carbon accounting platforms, carbon footprint modeling, verification consulting, and operation and maintenance services. For purchasers, understanding product price ranges, selection logic, and maintenance costs is key to avoiding the pitfalls of "prioritizing construction over operation" and "prioritizing equipment over data."
Market Structure: Expanding Beyond Key Industries
Currently, carbon emission monitoring demand is primarily concentrated in three scenarios:
- Compliance Monitoring in Key Industries: Including power, steel, cement, chemical, petrochemical, papermaking, and non-ferrous metal smelting. These industries feature concentrated emission sources and large flue gas volumes, making them suitable for deploying flue gas online monitoring equipment to track greenhouse gases like CO2, methane, and nitrous oxide in real-time.
- Park- and Regional-Level Monitoring: As industrial parks raise their low-carbon standards, monitoring networks are being deployed around plant boundaries, main roads, and energy stations. These projects emphasize spatial coverage, data fusion, and visual analysis capabilities compared to single-point monitoring.
- Supply Chain and Product Carbon Footprints: Export-oriented manufacturers are increasingly required to provide product carbon footprint data covering the entire life cycle—from raw material acquisition to end-of-life recycling. This demand focuses less on hardware installation and more on data governance, emission factor databases, and model-based accounting.
The core driver of market growth is shifting from a single policy-driven force to a multi-faceted drive encompassing compliance, operations, supply chain management, and financial disclosure.
Technical Routes and Price Ranges
Carbon emission monitoring utilizes various technical routes, including the emission factor method, mass balance method, and online monitoring method. The choice depends heavily on the specific application scenario and budget constraints.
Hardware Equipment Costs
Flue gas carbon dioxide online monitoring systems are widely used. A standard single CEMS system typically costs between 150,000 and 450,000 RMB. However, for complex operating conditions involving high temperature, humidity, or corrosion, prices can range from 350,000 to 800,000 RMB per set. Projects requiring simultaneous monitoring of multiple greenhouse gases generally fall between 400,000 and 1.2 million RMB.
Software Platform Investments
Prices for enterprise carbon accounting platforms vary significantly:
- Basic SaaS Services: 50,000 to 300,000 RMB annually, suitable for single enterprises.
- Localized Deployments: 600,000 to 2.5 million RMB, supporting multiple organizations and sites.
- Group-Level Platforms: 3 million to 8 million RMB, integrating multi-source data from ERP, MES, and DCS systems.
Maintenance Cost Analysis: The Hidden Variables
Maintenance costs are often underestimated but constitute a significant portion of the total cost of ownership. Industry practice estimates annual O&M costs at 8% to 15% of the initial equipment investment.
Hardware O&M
Includes regular calibration, consumable replacement (filters, probes), and analyzer drift checks. For a 200,000 RMB system, annual O&M is approx. 16,000–30,000 RMB.
Labor & Consulting
Full-time carbon specialists cost 80,000–200,000 RMB annually. External consulting for complex disclosures can add 30,000–200,000 RMB per year.
From a full life-cycle perspective, the ten-year total cost of a carbon emission monitoring project can reach 1.8 to 3 times the initial investment. Purchasers must consider calibration, spare parts, platform services, and personnel training in their budget models to avoid data gaps or verification failures.
Application Cases: Significant Differences in ROI
Real-world applications demonstrate diverse return profiles depending on the strategic goal:
- Large Chemical Enterprise: Invested 6.5–9 million RMB in online monitoring and a data platform. Result: Data missing rates dropped from 12% to <2%, and annual accounting preparation time shortened from 45 days to 7 days.
- Electronics Export Company: Invested ~450,000 RMB in carbon footprint accounting for three product lines. Result: Identified that purchased electricity and metals accounted for 62% of the footprint, enabling an 18% reduction in unit carbon intensity through green power procurement and process optimization.
- Industrial Park: Invested 4.8 million RMB in 8 monitoring points. Result: Enabled dynamic observation of emissions, providing a basis for investment access decisions and energy dispatch, shifting management from static statistics to active regulation.
Conclusion: From Compliance Tool to Infrastructure
The future of carbon emission monitoring will see rising data quality requirements, deep integration of accounting and footprints, and closer ties with energy management systems. For purchasers, these projects should be planned as long-term data infrastructure rather than one-off engineering tasks.
A rational selection path involves clarifying compliance goals first, defining accounting boundaries, improving basic metering before evaluating online monitoring needs, and piloting key sources before expanding. Only by balancing price, precision, stability, and maintenance costs can carbon data truly serve energy conservation, decarbonization, and business decision-making.