How a Water Group Achieved Cost Reduction and Efficiency via DMA Zoning Metering
Case Study: Network Leakage Rate Reduced from 16.8% to 9.7%
Against the backdrop of continuously rising operational costs in urban water supply systems, pipe network leakage control has become a crucial tool for refined management by water utilities. Since 2023, a water supply company in a central prefecture-level city has implemented a DMA (District Metered Area) zoning and metering project, focusing on core issues such as network leakage, zoned management, flow metering, and leakage rate control. The goal was to systematically upgrade the water supply networks in the old urban area and the urban-rural fringe.
Prior to the project, the area covered a water supply service area of approximately 68 square kilometers, serving a population of about 820,000. The total pipe network length was roughly 746 kilometers, with an average daily water supply of about 198,000 cubic meters. Because some pipes were laid in the 1990s—primarily using gray cast iron and concrete pipes—joint aging and localized settlement led to prominent issues of hidden leaks and seepage.
The Challenge: High Leakage and Complex Infrastructure
Before the project launch, the company's 2022 statistical data revealed significant inefficiencies:
- Network Leakage Rate: 16.8%
- Non-Revenue Water Rate: 18.5%
- Average Network Pressure: 0.32 MPa (with significant fluctuations in high-elevation areas)
- Pipe Bursts: 63 incidents involving DN100 and above pipes in 2022
The existing metering system relied mainly on water plant outlet metering and a few regional master meters, lacking secondary and tertiary district metering nodes. This made it difficult to quickly locate leaks once they occurred. Maintenance work largely depended on user reports and manual inspections, leading to delayed detection, long resolution cycles, and repeated excavation.
Technical Difficulties
The project faced three main technical hurdles:
- Incomplete Underground Data: In the old urban area, original drawings did not reflect some branch pipes, reserved outlets, and abandoned pipelines, making accurate boundary delineation difficult.
- Complex Connectivity: Cross-supply existed among multiple residential communities, municipal roads, and industrial parks. Strict isolation was required to ensure flow data accuracy.
- Minimum Night Flow (MNF) Interference: MNF analysis was easily disrupted by residential water use, landscaping irrigation, industrial production, and fire hydrant testing, requiring a stable data correction model.
Implementation Strategy: Survey, Zone, Meter
To address these issues, the project team adopted an implementation path of "first survey, then zoning, and finally metering."
Phase 1: Data Verification & Zoning
Initially, pipeline detection, valve surveys, and GIS data verification were utilized to review the current status of the 746-kilometer network. This process supplemented 128 missing pipeline records and corrected the coordinates of 216 valves. Based on the water supply layout, pressure boundaries, and maintenance requirements, the project area was divided into 32 DMA zones:
- 6 Primary Zones
- 11 Secondary Zones
- 15 Tertiary Zones
Phase 2: Equipment Configuration
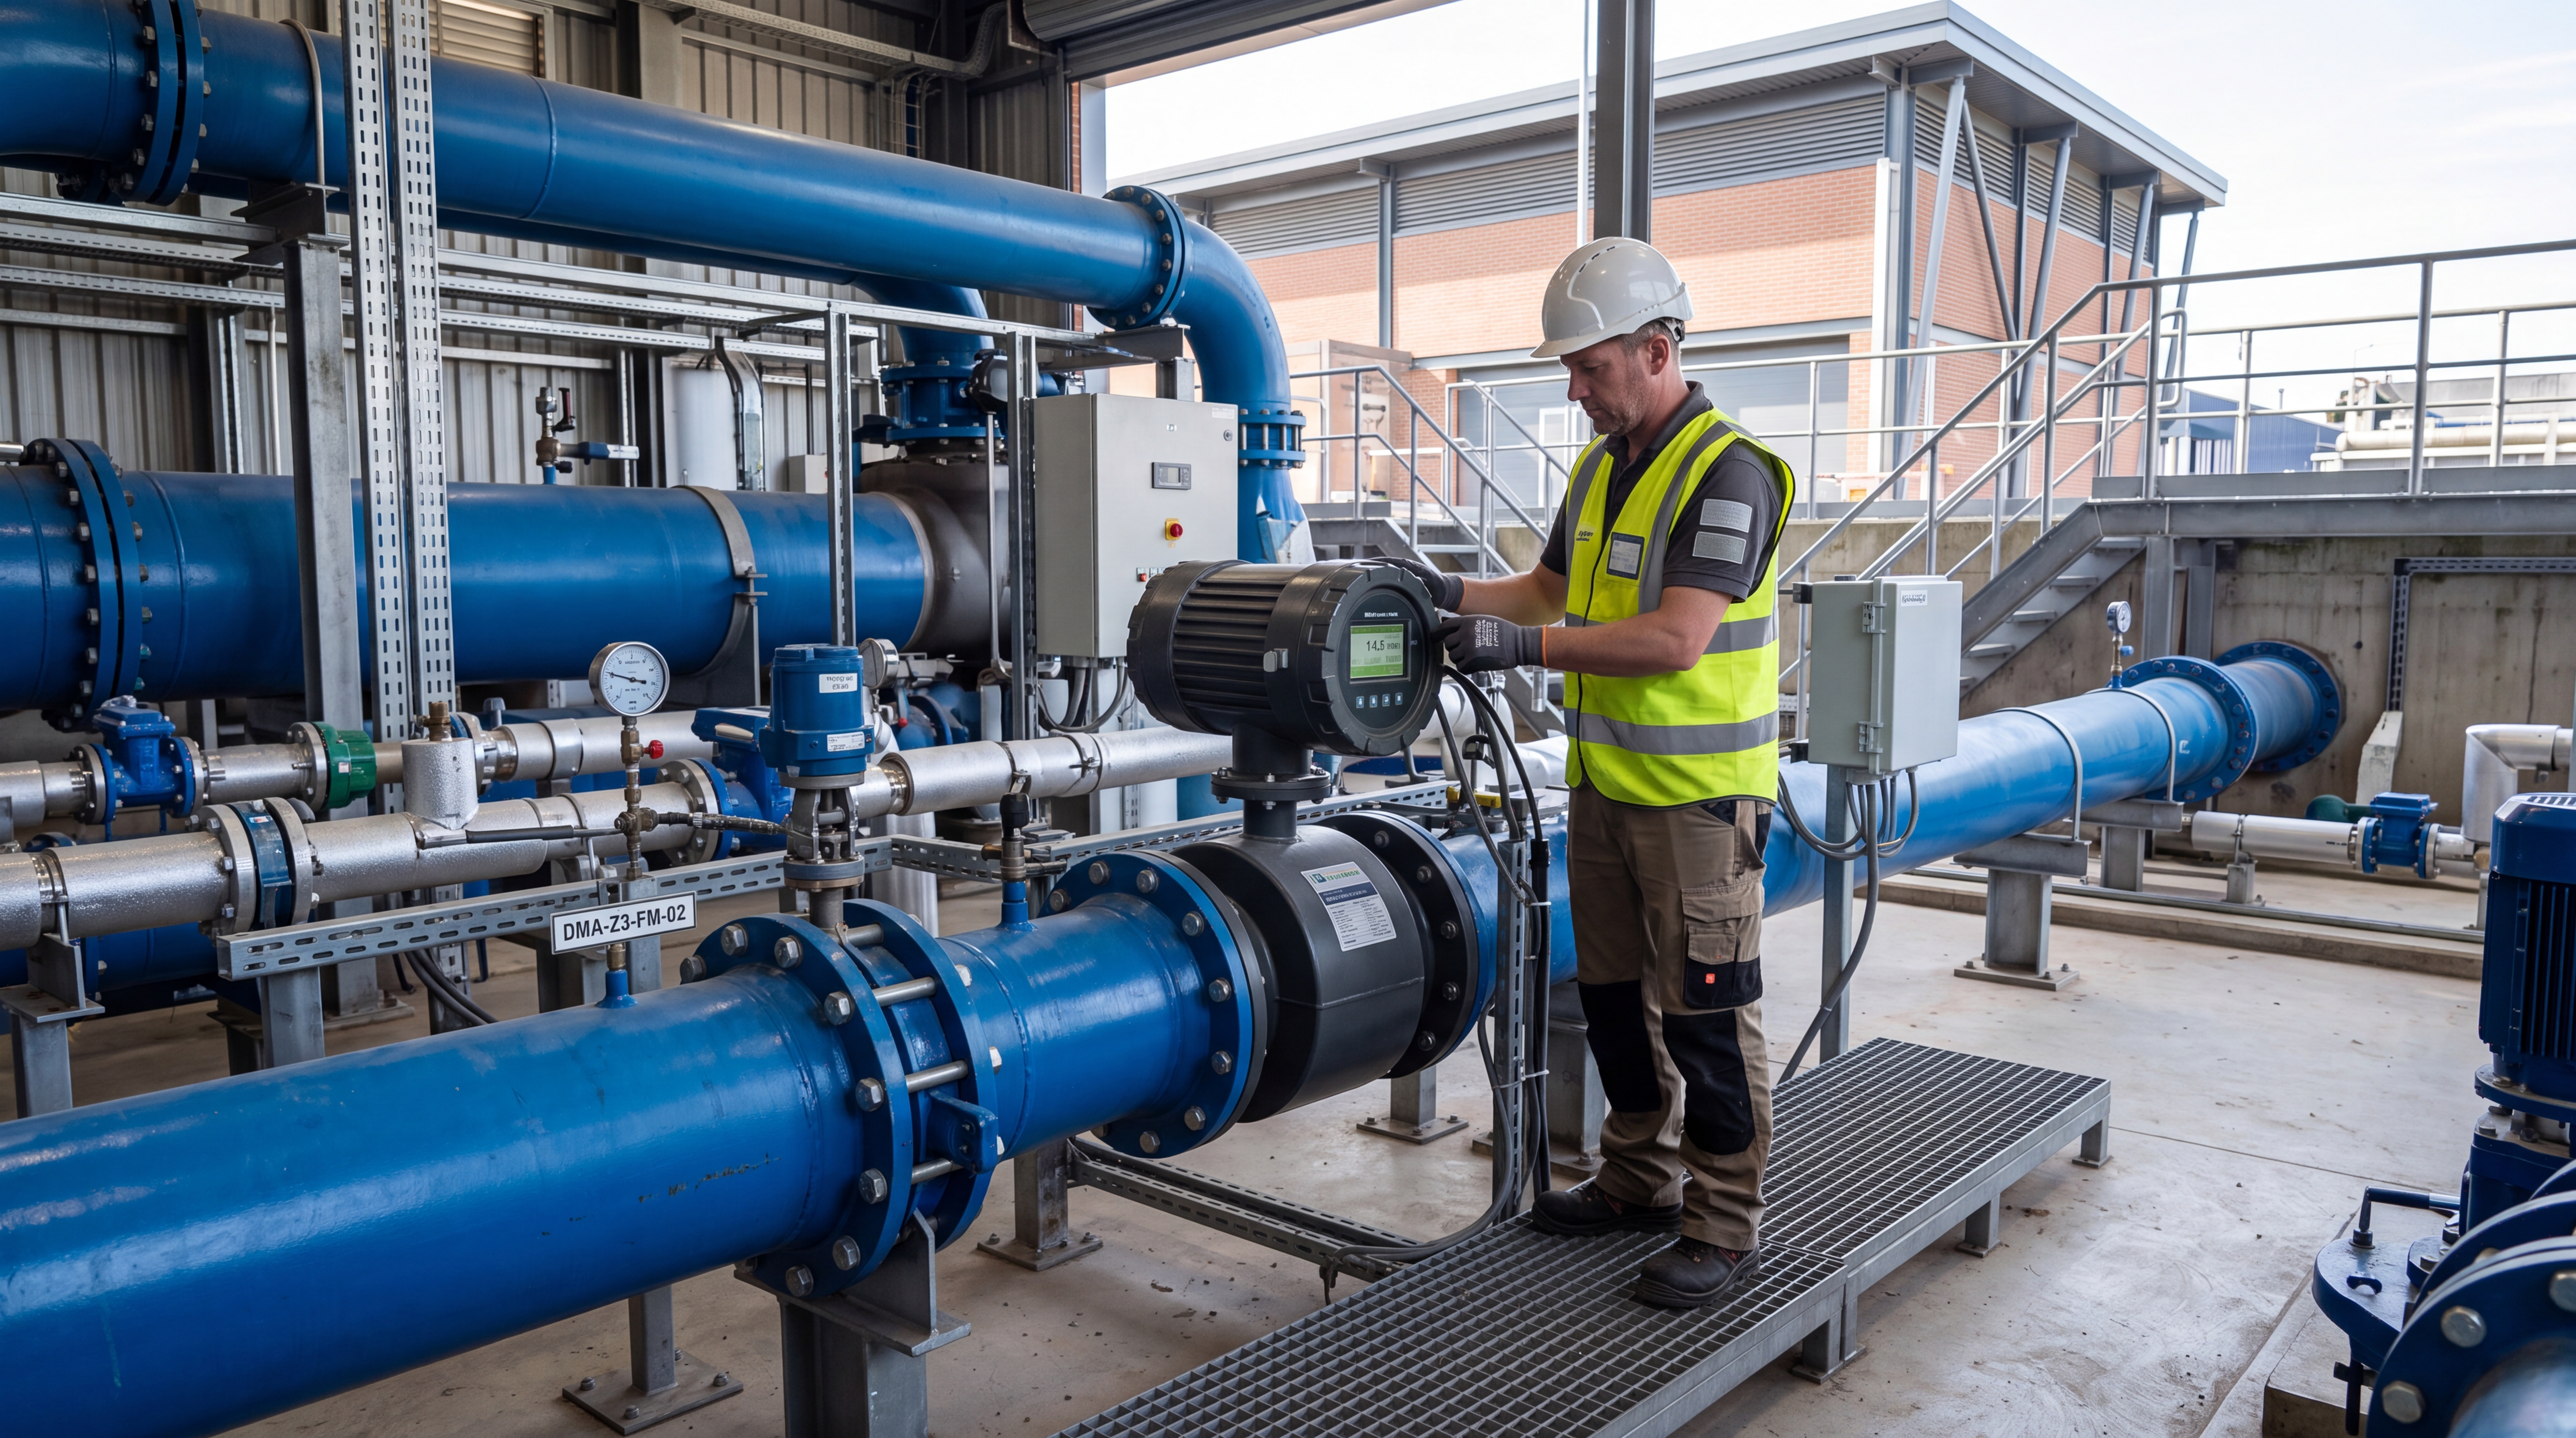
Electromagnetic flowmeters were installed at the inlet of each zone, accompanied by pressure transmitters, data acquisition terminals, and remote communication modules. This setup enabled flow and pressure data to be uploaded every 15 minutes. Key equipment included:
- 58 Electromagnetic Flowmeters (DN50 to DN300)
- 76 Pressure Monitoring Points
- 62 Remote Data Acquisition Units
To enhance small flow identification capabilities, DN80 to DN150 flowmeters were predominantly used at residential community inlets, with zero drift calibration conducted during low-flow night periods. A water balance analysis table was established to separately account for water supplied, water billed, unbilled authorized consumption, metering errors, and physical losses.
"Through zonal flow comparison, managers can determine whether abnormal leakage exists in a specific area, and then conduct targeted investigations using acoustic correlators, noise loggers, and manual leak detection."
Project Timeline & Execution
The implementation was divided into three distinct phases:
- Mar–May 2023: Completed basic data compilation, zoning scheme demonstration, and pilot area construction.
- Jun–Oct 2023: Completed installation of metering equipment for all 32 DMA zones, valve maintenance, and boundary isolation.
- Nov 2023–Feb 2024: Carried out data joint debugging, Minimum Night Flow (MNF) analysis, and leakage point repairs.
During the execution period, the project team cumulatively closed or repaired 96 failed valves, addressed 47 illegal connections and metering anomalies, and repaired 128 hidden leak points (including 31 leaks on pipes above DN100 and 97 leaks on internal community branch pipes).
Results: Significant Cost Reduction and Efficiency Gains
From an operational perspective, the establishment of the DMA zoning and metering system has yielded substantial results:
- MNF Reduction: Dropped from an average of 412 m³/h to 236 m³/h, a decrease of approximately 42.7%.
- Leakage Rate: Fell from 16.8% to 9.7% in Q1 2024.
- Non-Revenue Water: Decreased from 18.5% to 11.2%.
- Water Loss Savings: Annual water loss reduced by approximately 5.18 million cubic meters.
- Economic Impact: Calculated at the local comprehensive non-residential water price of 2.85 RMB/m³, annual economic loss was reduced by about 14.76 million RMB.
- Pressure Optimization: Average network pressure optimized by ~0.06 MPa, leading to a 38% year-on-year decrease in pipe bursts in Q1 2024.
Strategic Insights & Future Outlook
The project revealed that district metering is not merely an equipment installation project, but the result of coordinated advancement in network baseline data, metering accuracy, dispatch operations, and maintenance mechanisms. For instance, early in the operation, individual DMA zones exhibited high night flows due to unmetered landscaping water use. Data stability was subsequently improved by separating non-residential water use, adding dedicated landscaping meters, and adjusting the analysis model.
Industry experts believe that the value of DMA zoning and metering lies not only in detecting leak points but also in driving water utilities to shift from experience-based judgment to data-driven decision-making, providing a basis for prioritizing network renewal and retrofitting.
Overall, through the closed-loop management of zoning, metering, monitoring, and repair, this project achieved a significant reduction in the network leakage rate, providing a referenceable pathway for the retrofitting of water supply systems in similar old urban areas. With the further integration of smart metering, pressure regulation, and network models, DMA zoning and metering is expected to upgrade from a leakage control tool to a foundational management platform for the safe operation of water supply networks.
Key Takeaway: Continuously improving data quality, maintaining equipment online rates, and establishing normalized analysis mechanisms are key to determining the long-term effectiveness of district metering.

