From Technical Challenges to Successful Implementation: A Record of an Urban Pipeline Network Project
Case Study: DMA District Metering in the High-Tech Zone – Reducing Leakage from 18.6% to 9.3%
Yicai Technology recently learned from the completion documents of the district metered area (DMA) project for the water supply network in the high-tech zone of a certain city that the project covers 42 square kilometers of water supply service area, 286 kilometers of pipelines, and 128,000 customer connections.
By establishing a three-level districting system, improving boundary metering, and deploying pressure monitoring, the network leakage rate in the district was reduced from 18.6% before implementation to 9.3% at acceptance. Annual leakage water loss was reduced by approximately 15.06 million cubic meters.
This case demonstrates that DMA is not merely the installation of flow meters, but the result of coordinated water loss control, districting, metering, data governance, and operation and maintenance mechanisms.
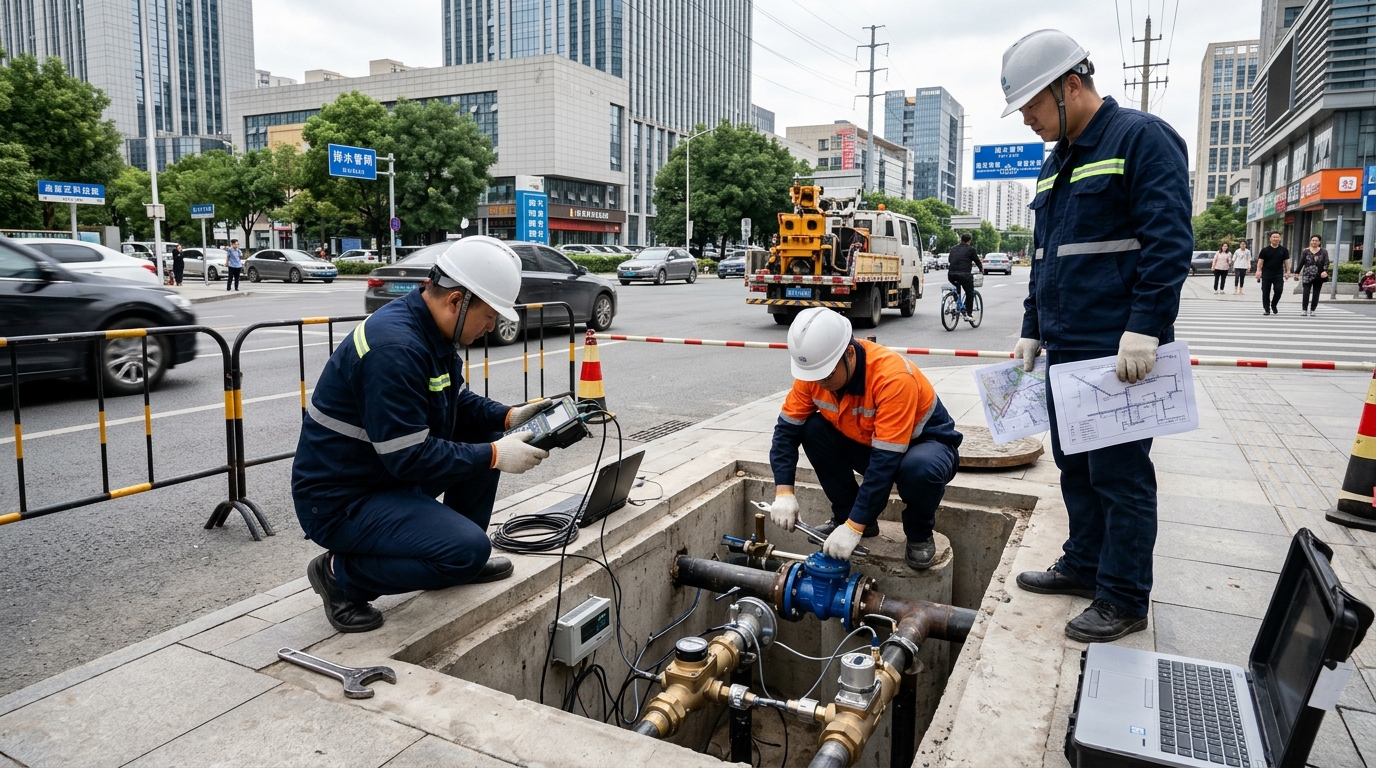
I. Project Background: Aging Pipe Networks and High Leakage Rates
The high-tech zone is located in the eastern part of the city. Its water supply system was built in the early 2000s, featuring pipeline materials including grey cast iron, ductile iron, galvanized steel pipe, and PE pipe, with diameters ranging from DN100 to DN800.
Pre-Project Statistics
- Average Annual Water Supply: ~162 million cubic meters
- Billed Water Volume: Long below 135 million cubic meters
- Non-Revenue Water (NRW): Remained around 15.8%
- Network Leakage Rate: Approximately 18.6%
- Burst Pipe Incidents: Avg. 37 per year (46% occurred at night/early morning)
On-site inspection revealed issues such as unclear pressure zone boundaries, missing or corroded branch valves, unsealed bypasses, and poor installation conditions for metering points. Approximately 23% of branch pipe locations in the GIS required verification. Without first completing districting and metering, it was difficult to determine which pipe segment was leaking, preventing precise deployment of resources for emergency repair and renewal.
Prior to launch, the utility relied mainly on manual leak detection. A single DN600 burst pipe affected 32,000 customers, with emergency repairs lasting 31 hours, exposing the problem that missing district boundaries caused excessively large water outage areas. Management decided to treat DMA district metering as critical infrastructure for water loss control.
II. Technical Challenges: Boundary Closure, Accuracy, and Data Quality
1. Boundary Closure
Existing networks had mixed tree and loop structures with 573 branch connections. Construction under storefronts and main roads required coordination of water outages and traffic detours. The team adopted a "closable, monitorable, traceable" principle.
2. Metering Data Quality
Small-diameter districts faced low nighttime flows below meter limits, amplifying errors. Large boundaries suffered from insufficient straight pipe runs. Solutions included combining electromagnetic, ultrasonic, and remote-reading meters with ±2% accuracy for key boundaries.
3. Operation & Maintenance
Once operational, data anomalies, false alarms, and missed alarms impacted decision-making. Effective work order closure became critical for sustaining leakage reduction.
III. Solution: Three-Level Districting & Platform Integration
The solution adopted a hierarchical architecture:
- Level 1: Divided the entire district into 4 pressure management areas.
- Level 2: Established 18 DMAs.
- Level 3: Deployed 32 micro-DMAs in key residential communities, hospitals, schools, and industrial parks.
Instrumentation Deployment
• 126 Flow Meters: Electromagnetic meters for DN300+ boundaries; ultrasonic/remote-reading for micro-DMAs (
• 26 Water Quality Points: Assessing risks of burst pipes and secondary contamination.
Data Transmission & Logic
Hybrid NB-IoT and 4G DTU approach uploaded boundary flow/pressure every 15 minutes. The platform established a water balance model. Alarms triggered when night minimum flow exceeded baseline by 15% for 3 periods, or if sudden flow surges coincided with >0.05 MPa pressure drops.
IV. Implementation Process: From Modeling to Construction
The project spanned 18 months:
Months 1-3: Field Investigation
Completed surveys over 42 sq km, verified 128k customer meters, and re-surveyed 286 km of pipelines.
Months 4-9: Design & Hydraulic Modeling
Used EPANET-like models to simulate boundaries and pressure distribution, finalizing plans for 18 DMAs.
Months 10-18: Construction & Commissioning
Executed 237 pipeline modifications, installed 126 meter sets, and connected 318 pressure points. Followed "simulate first, excavate later, then verify" protocol.
Construction on main traffic roads utilized 22:00–05:00 windows, with 48-hour advance notice to customers. Temporary supply points were set up for hospitals and schools. Staffing included a 12-person field team coordinating with local authorities. During commissioning, 62 frontline personnel were trained to interpret night minimum flow and pressure baselines, reducing reliance on traditional experience.
V. Monitoring Platform: Turning Leakage from Hard-to-Detect to Locatable
Case Example: DMA B-06
In this district covering 16,000 customers, the boundary flow meter recorded night minimum flow rising from 3.8 m³/h to 9.6 m³/h (>150% increase) over two nights.
Combined with pressure data, the platform narrowed the suspected area to a 420-meter DN300 branch segment. On-site verification confirmed a crack within 26 hours. Post-repair, flow returned to 4.1 m³/h.
The project established a closed-loop mechanism: "Flow Anomaly → Pressure Anomaly → Customer Complaint → On-Site Verification."
4.7d → 1.2d
Avg. Leakage Discovery Time
26h → 6.5h
Avg. Repair Time
-62%
Nighttime Burst Complaints
VI. Final Results: Economic & Environmental Impact
Key Performance Indicators
- Leakage Rate: Dropped from 18.6% to 9.3%
- NRW: Dropped from 15.8% to 11.4%
- Water Saved: ~15.06 million m³ annually
- Payback Period: ~3.2 years (Static)
Financial & Social Benefits
- Direct Water Saving Value: ~27.1 million RMB/year
- Total Comprehensive Savings: ~31 million RMB/year
- Energy Savings: ~5.27 million kWh/year (due to lower pump load)
- Equivalent Domestic Use: Saves water for ~50,000 households
Acceptance showed all 18 DMAs had independent metering and controllable boundaries. While 15 DMAs stabilized within ±10% of baseline, 3 remained under rectification due to initial data fluctuations from unauthorized hydrant use and irrigation flushing. This highlights the need for long-term data governance.
VII. Outlook: Deep Integration of Data and Renewal
The key to leakage control is forming a closed loop among districting, metering, pressure management, and emergency repair. DMA provides "locatable" units, but sustainability requires truly controllable boundaries and reliable data quality.
Looking ahead, utilities can integrate DMA data with GIS, hydraulic models, digital twins, and AI prediction to shift from reactive repair to proactive prevention. Next steps include building leakage prediction models, extending pressure management to customer endpoints, and incorporating metering anomalies into broader project portfolios.
"The value of DMA projects is ultimately reflected in long-term operational capability, rather than short-term indicators at completion." — Yicai Technology

