DMA District Metered Area Routine Maintenance and Troubleshooting Manual
Introduction: District Metered Area (DMA) metering is a critical step for moving pipeline leakage control from experience-based judgment to data-driven management.
The Shift to Data-Driven Leakage Control
After long-term operation of urban water supply networks, factors such as loose pipe joints, corrosion of aging pipe materials, internal valve leakage, water theft, and abnormal pressure can cause pipeline leakage. Traditional methods relying on manual acoustic leak detection, localized repairs, and reactive emergency repairs make it difficult to systematically determine leakage locations, leakage magnitude, and continuing trends. DMA metering divides the network into several relatively independent management units and installs flow and pressure metering facilities at each zone boundary, enabling water utilities to compile water supplied, water sold, night minimum flow, and pressure changes by area, thereby transforming the leakage rate from a macro indicator into a locatable, analyzable, and actionable operations and maintenance object.
From industry practice, DMA metering is not simply installing a few flow meters; it is a systematic engineering involving network inventory, zone boundary design, metering device selection, construction and installation, platform integration, data calibration, and ongoing operations and maintenance. A well-operated DMA system can usually reduce leakage rate from above 20% to 10% to 12%, and some cities with better infrastructure can reduce it further below 8%. Its core value lies in using zone data to narrow leakage investigation scope, using metering curves to identify anomalies, using pressure and flow correlation to assess network condition, and using long-term trends to evaluate repair effectiveness.
I. Pre-installation Preparation: Pipeline Boundary Mapping and DMA Unit Division
The first step of DMA metering is not purchasing equipment, but clarifying “where the pipes are, where the water comes from, and where the water goes.” In practice, priority should be given to collecting pipeline GIS data, pipe diameter information, historical leakage records, pressure monitoring points, meter accounts, and nighttime water-use data. For old urban areas, urban villages, industrial parks, high-rise residential buildings, commercial complexes, and aging pipeline areas, it should be assessed separately whether they are suitable for independent DMAs. It is generally recommended that each DMA cover 2,000 to 15,000 residential users, or that boundaries be determined according to pipeline topology completeness; boundaries should not be too large, which makes leakage localization difficult, nor too small, which causes excessive investment and complex operations and maintenance.
Boundary Design Principles
Boundary design should follow the principles of “few boundaries, closable, easy to meter, and few bypasses.” The inlet and outlet of each DMA should be as concentrated as possible to facilitate the installation of flow meters and pressure sensors. Boundary valves must have reliable closure capability. For boundary pipe sections from DN100 to DN600, gate valves, butterfly valves, or valves with limit control should be preferred, and valve number, pipe diameter, pressure class, and closing torque should be recorded. If the network contains multiple unregistered bypasses, temporary construction connections, or fire service connections, they must be investigated before installation; otherwise, subsequent metering data will show obvious deviations.
Device Selection Criteria
- Flow Meters: Determined by pipe diameter, flow range, and pressure conditions. Small/medium DMAs typically use DN50–DN200 electromagnetic or ultrasonic flow meters; large boundaries may use DN300+ electromagnetic or insertion-type ultrasonic meters.
- Accuracy Standards: Metering accuracy no worse than ±2%, repeatability no worse than ±1%. Pressure sensor accuracy recommended Class 0.5 or higher.
- Communication & Power: Specify NB-IoT, 4G, LoRa, fiber optic, or dedicated municipal networks. Consider mains power, solar, lithium batteries, or combined supplies.
II. Installation Steps: From Measurement Point Layout to On-site Construction
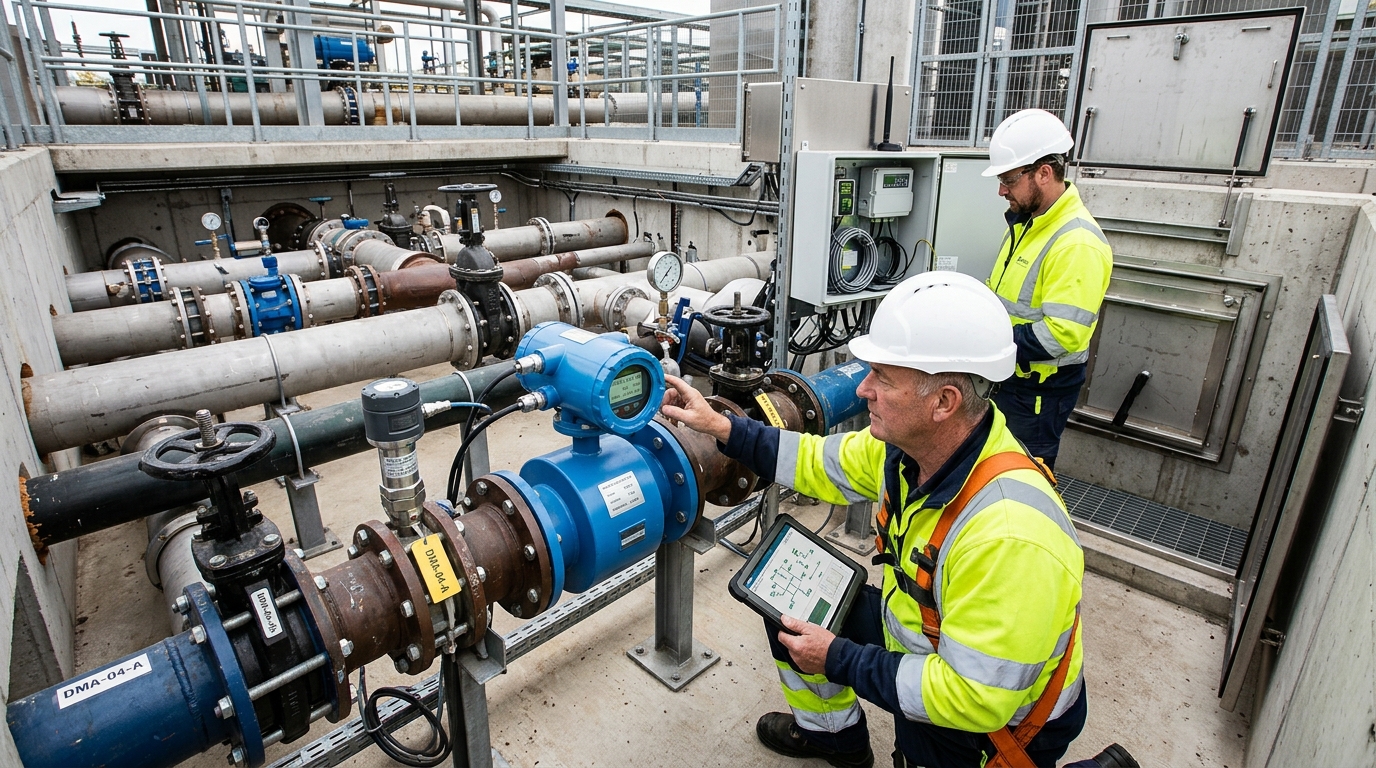
Before installation, conduct a field survey to confirm manhole chamber dimensions, pipe material, burial depth, valve location, power connection conditions, communication signal strength, and construction space. Address specific pipe materials (ductile iron, steel, PE) with appropriate tapping, welding, electrofusion, or flanged connections. For underground chambers, verify load capacity, waterproofing, ventilation, and ladder conditions. Road excavation requires permits, barriers, warning signs, and reflective facilities to minimize traffic impact.
Flow Meter Placement
Avoid turbulent zones caused by elbows, tees, valves, and pump outlets. Maintain upstream straight pipe length ≥ 5–10x diameter and downstream ≥ 3–5x diameter. Ensure full pipe flow for electromagnetic meters; ensure flat coupling surfaces for ultrasonic meters.
Pressure Sensor Setup
Install near flow meters or representative zone points. Use stop valves, buffer loops, and filters to prevent diaphragm blockage or water hammer damage.
Complete boundary valve construction simultaneously. Install electric or manual remote-operated valves for long-term monitoring sites, retaining mechanical operation capability. Perform closure tests to check for internal leakage or sticking. Pipe pressure testing should use short-term holds at 1.0–1.5 times working pressure, avoiding peak demand periods and issuing outage notices.
Electrical and communication installations require independent checks. Mains-powered sites need residual current protection, grounding, lightning protection, and waterproof boxes. Battery sites need reserved replacement space and recorded discharge curves. Verify SIM status, signal strength, antenna orientation, and waterproof connectors. Configure local caching on data collectors to prevent loss during interruptions. Enter all device IDs, coordinates, ranges, and intervals into the platform to form a traceable ledger.
III. Commissioning Methods: Validating Metering Reliability
The core objective is confirming that “data can be uploaded, values are reliable, and anomalies can be identified.” Start with static commissioning: power-up, communication connection, platform registration, time synchronization (deviation < 1 minute), and parameter configuration. Set upload intervals based on needs (1–15 minutes common; 5–10 minutes for high-localization areas).
Dynamic Flow Commissioning: Record flow changes before and after boundary valve closure. With the DMA fully closed and no internal use, flow should approach zero. Non-zero readings indicate zero drift, unsealed bypasses, pressure fluctuations, EMI, or air locks.
Pressure commissioning focuses on sensor range and linearity. Compare low-demand, peak-demand, and nighttime pressures with nearby monitoring points. Normal urban pressure is typically 0.25–0.65 MPa. Sudden drops suggest bursts, high usage, accidental valve opening, or pump shutdowns. Sustained high pressure increases leakage risk and may require PRV or VFD adjustments.
Night Minimum Flow (NMF) commissioning is highly valuable. Select 2:00 AM to 4:00 AM as the low-use period. High NMF in residential DMAs indicates background leakage, unregistered use, hydrant leaks, or joint damage. Establish a historical baseline; if normal NMF is 25–35 m³/h and rises to 60–80 m³/h consecutively, trigger an investigation work order.
IV. Daily Maintenance: Synchronizing Data and Field Inspections
Divide maintenance into field inspection and data inspection. Key DMAs, commercial areas, and old networks should be inspected monthly; general areas quarterly. Check manholes for water accumulation, cover damage, equipment appearance, battery voltage, signal strength, valve status, grounding, and sensor fixation. Inspect underground chambers for sewage backflow, cable aging, rodent damage, and moisture corrosion.
Battery & Power Care
Lithium/lead-acid batteries lose capacity in cold/humid conditions. Record voltage and charge/discharge curves quarterly. Clean solar panels regularly. Check distribution box locks, RCDs, and waterproof seals for mains-powered sites.
Valve & Accessory Upkeep
Operate boundary valves fully open/close every 6–12 months to prevent rust/sticking. Check electric valve limits and feedback. Clean filters/sensors every 6 months (quarterly in high-impurity areas). Apply anti-freezing measures in winter.
Data inspection focuses on sudden flow/pressure changes, NMF trends, offline rates, and data loss. Set platform alarms for zero flow with historical consumption, >20% NMF rise over baseline, or >0.05 MPa pressure drop lasting >10 minutes. Form closed-loop work orders verified by O&M personnel. Escalate persistent similar alarms to avoid neglecting systemic leakage.
V. Common Fault Troubleshooting
Follow the sequence: “data before field, boundary before internal, device before network.”
High Flow / Elevated NMF
Causes include background leakage, unregistered connections, theft, hydrant leaks, valve internal leakage, zero drift, or partial pipe flow. Close boundary valve: if flow returns to zero, issue is inside DMA (use bisection method); if not, check bypasses, valve leakage, and meter zero.
Low Flow / Zero Flow
Causes include offline status, no water, closed valve, damaged meter, power loss, comms failure, or config errors. Check collector online status/voltage. If pressure is normal but flow is zero, suspect meter failure or partial flow. If pressure is zero, suspect upstream shutoff. Check electrodes/lining for EM meters; coupling/bubbles for ultrasonic.
Excessive Fluctuations
Caused by interference, short sampling periods, pressure pulsation, VFD switching, large user intermittency, or loose mounting. View raw high-frequency vs. smoothed minute-level data. Correlate with pump logs. Label commercial water use types to reduce invalid alarms.
Pressure Anomalies
High Pressure: PRV failure, improper pump settings, dispatch issues, or elevated measurement point.
Low Pressure: Burst, high usage, opened valve, blockage, or pump failure.
Troubleshoot: Drop + Large Flow Rise = Burst/Large Leak. Drop + No Flow Increase = Dispatch/Blockage/Sensor Fault. Fluctuation + Stable Flow = Jitter/Power/Comms Delay.
Offline & Data Loss
Check SIM expiry, signal decline, antenna damage, module restart, cert expiry, time sync, and cache overflow. For NB-IoT, check coverage/base station switching. For LoRa, check gateway/channel/height. For Fiber, check pigtail/switch/port. Prioritize sites offline >24 hours due to expanding leakage risk.
VI. Case Study: Reducing Leakage Rate in an Old Urban District
A medium-sized city’s old district had mixed pipe diameters (DN100–DN400) and materials (cast iron, ductile iron, steel, PE). Pre-retrofit leakage was ~22%. Complex connections and unknown nighttime use made manual detection inefficient. The problem was long-term background leakage, internal valve leaks, and unregistered use.
The project team surveyed the network, identifying three unregistered bypasses and five leaking boundary valves. They divided the area into 8 DMAs (4,000–9,000 households each), installing electromagnetic flow meters, pressure sensors, and 4G terminals. Construction focused on waterproofing, straight pipe sections, and valve replacement. Commissioning revealed three DMAs with high NMF (up to 1.8x baseline).
Results After 1 Year
- Leakage Rate: Reduced from ~22% to ~11%.
- Response Time: Average burst repair shortened from 4.5 hours to < 2 hours.
- Detection: 146 anomaly work orders led to fixing 58 points (23 joint leaks, 11 hydrant leaks, 8 valve leaks, 16 unregistered uses).
- Stability: Pressure fluctuations decreased significantly.
This case demonstrates that DMA benefits extend beyond water saving to smaller repair scopes, clearer priorities, and visualized network health.
VII. Management Closed Loop: Converting Data into Action
DMA must integrate with O&M management. Platform data must drive “who handles it, when, how, and verification.” Establish a three-tier work order mechanism:
- Tier 1 (Equipment): Offline, low battery, communication anomalies.
- Tier 2 (Data): Increased NMF, sudden pressure changes, flow/meter mismatch.
- Tier 3 (Field Intervention): Suspected bursts, leak repairs, theft verification, bypass clearing.
Assess performance using leakage rate, NRW, NMF, leakage per unit pipe length, mean time to repair, recurring incidents, and data completeness. Note that standalone leakage rate is influenced by reading cycles and seasons; combine with NMF trends. Prioritize restoring metering capability if DMA data completeness falls below 90%.
Combine DMA with renewal, pressure regulation, and quality monitoring. Manage pressure actively: reducing pressure lowers background leakage. Evaluate PRVs, VFD pumps, and dispatch plans for areas with peak pressure >0.65 MPa or nighttime >0.45 MPa.
VIII. Outlook: Intelligent Pipeline O&M
Future DMA evolution focuses on improving data quality and analysis rather than just adding devices. The trajectory is toward higher-frequency, more accurate, and more intelligent pipeline operations and maintenance.

