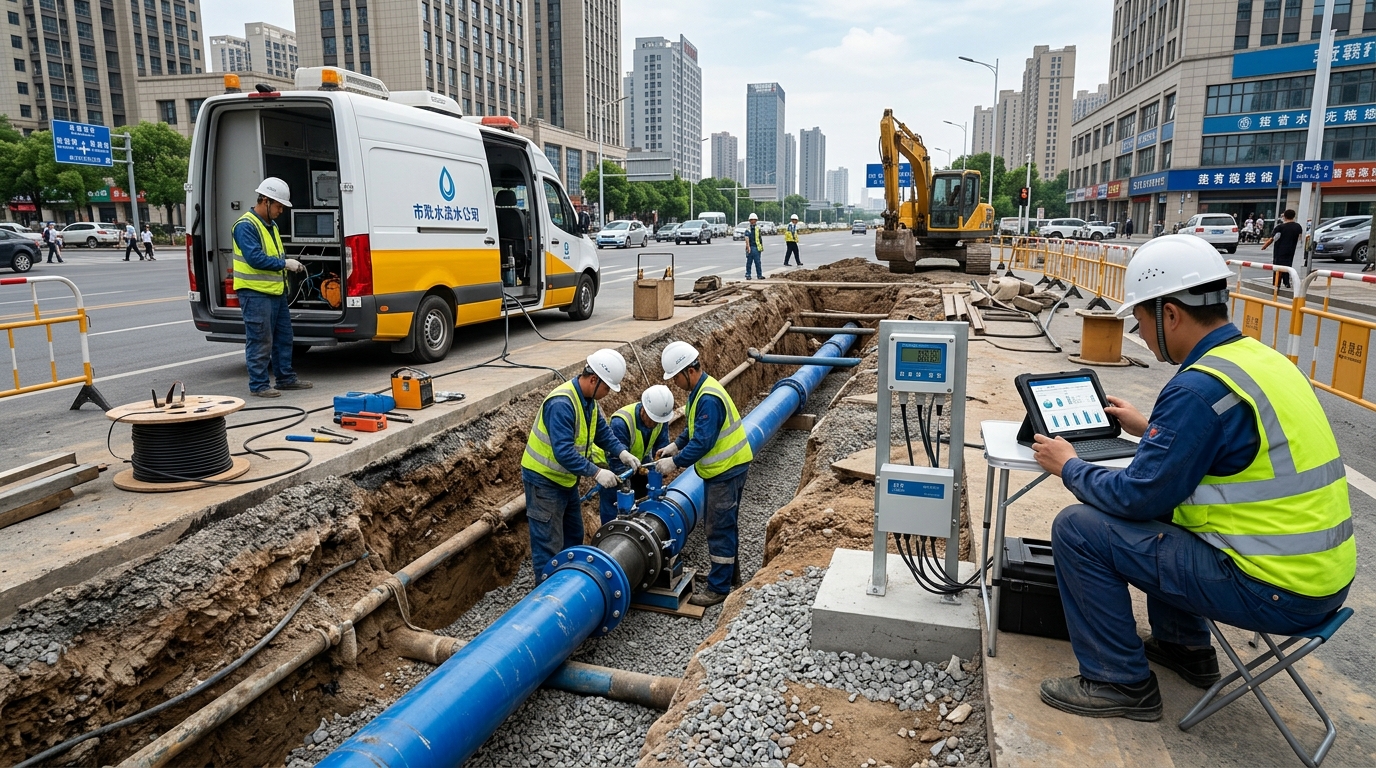
Development Opportunities for Urban Pipe Networks in 2026 under the Dual Carbon Goals
Yicai Technology News Editors' Analysis

Urban water supply pipe networks are transitioning from “underground assets” to “public governance infrastructure.” With multiple factors overlapping—continued urbanization, renewal of aging pipe networks, construction of water-saving cities, and smart water upgrades—indicators such as pipe network leakage, zoning, metering, and leakage rates are no longer merely numbers in operational reports. They have become key variables directly affecting urban water security, fiscal investment efficiency, water supply service quality, and carbon emissions management.
For a period in the future, the urban pipe network industry will gradually shift from engineering-driven models to “data-driven + operations and maintenance closed-loop” driven models. Leakage governance will enter a more refined, longer-term, and more institutionalized stage.
Policy Targets: From Statistical to Governance Indicator
In the past, control of leakage in urban water supply pipe networks was often regarded as an internal operational issue for water utilities, focusing on burst repair, manual inspection, and emergency response. However, with the implementation of the “14th Five-Year Plan for Building a Water-Saving Society” and requirements from the Ministry of Housing and Urban-Rural Development, the leakage rate has begun to transform into a public governance indicator with a clear timetable.
Key Policy Targets
- By 2025: National urban public water supply pipe network leakage rate controlled within 9%.
- By 2030: Effort made to control leakage rate within 7%.
This requires systems that not only “deliver water” but also “leak less, lose less, and waste less,” supported by verifiable and traceable data foundations.
Policy influence is restructuring the governance chain. Water utilities must establish leakage ledgers, District Metered Area (DMA) systems, and annual control plans. Competent authorities are incorporating Non-Revenue Water (NRW) rates and repair timeliness into urban operation assessments. Departments across finance, development, housing, water resources, and ecology are forming coordinated efforts for pipe network renewal, old community renovation, and waterlogging control.
Market Trends: Renewal, Smart Management, and DMA Scale-Up
Industry statistics indicate that the cumulative length of urban water supply pipe networks nationwide exceeds one million kilometers, with a significant portion built during early rapid urbanization. Issues like material aging, joint loosening, and road load changes are becoming apparent. Consequently, the market is shifting from “new construction expansion” to equal emphasis on renewal, repair, monitoring, and Operations & Maintenance (O&M).
Investment Directions
- Renovation of aging pipe networks
- Burst repair and pressure zoning
- District metering and smart water meters
- GIS-based asset management
- SCADA system upgrades
- Digital twin platform construction
Changing Market Structure
Projects are moving from pure capital investment (pipe replacement, excavation) to prioritizing operational efficiency. Digital capabilities like night-time minimum flow analysis, leak point localization, and work-order closed loops are shifting from "optional" to "necessary."
In eastern coastal areas, the Yangtze River Delta, Pearl River Delta, and Beijing-Tianjin-Hebei, policy constraints and tariff reforms drive refined leakage control. Conversely, county-level markets face challenges like weak records and insufficient personnel, creating demand for lightweight, replicable, and maintainable district metering solutions.
Technology Pathway: From Passive Repair to Predictive Governance
The technical pathway for leakage governance is evolving through three stages:
Passive Emergency Repair
Organizing repairs after bursts, visible leaks, or user complaints.
Proactive Detection
Using acoustic detectors, correlators, noise recorders, and manual inspection to find hidden leaks.
Predictive Governance
Leveraging multi-source data fusion, hydraulic models, machine learning, and edge computing to identify high-risk segments and anomalies in advance.
Truly effective leakage control is not a single-point technological breakthrough, but a closed-loop capability of sensing, analysis, treatment, and review.
Key Technical Parameters
- Night-Time Minimum Flow: Typically analyzed between 2:00 AM and 5:00 AM. If flow remains >20% above baseline or shows trend-wise increases, it indicates hidden leaks, unauthorized use, or meter errors.
- Pressure Management: Supply pressure usually controlled within 0.2–0.5 MPa. Combined with district metering, this can reduce leakage rates by 1–3 percentage points, depending on soil conditions and O&M capability.
Zoning and Metering: DMA as an Operations System
A common misconception is viewing District Metered Areas (DMAs) simply as “installing remote-reading meters.” In reality, the core of a DMA is the management unit, not just the equipment. A typical DMA covers 500–3,000 households with 1–10 km of pipe network, bounded by valves and meters to create a closed area.
The Difference Between NRW and Leakage Rate
Assessing only leakage may ignore metering errors; assessing only NRW may misjudge management issues as engineering problems. Both must be advanced simultaneously.
Effective zoning requires Level 1 zones for total volume accounting, Level 2 for district identification, and Level 3 DMAs for fine-grained localization. Data reliability depends on controlling metering errors (e.g., ±2% accuracy for remote reading) and shortening reading cycles to hourly or daily intervals.
Data and Algorithms: The Field Closed Loop
As NB-IoT meters, pressure sensors, and GIS systems connect, algorithms can identify anomalies from night-time flow, pressure fluctuations, and historical records. However, pilots show that algorithmic “suspected leak points” are not always exact excavation spots due to complex underground environments and signal interference.
Some models compress localization error to 10–20 meters under ideal conditions, but field verification remains critical. The key to success is establishing a closed loop:
- Data Anomaly Detection
- Field Verification
- Excavation Validation
- Repair Record Creation
- Effect Review
Response time limits should be defined: recheck continuous night-time anomalies within 7 days, respond to suspected visible leaks within 24 hours, and prioritize high-risk burst warnings. Ultimately, organizational processes and personnel capabilities determine leakage reduction more than algorithmic accuracy alone.
Case Studies: Costs, Benefits, and Constraints
Northern Prefecture-Level City
Scale: ~100,000 m³/day
Action: Built ~50 DMAs, deployed remote meters, replaced aging pipes.
Result:
- Leakage rate dropped from 13.5% to 8.2%.
- Annual water loss cut by ~2 million m³.
- Payback period estimated at 5–7 years.
Southern Aging Urban District
Challenge: High density, complex excavation, frequent bursts.
Action: Smart meters, GIS ledgers, work-order linkage.
Result:
- Emergency response time shortened from 72h to 18h.
- Leakage rate decreased by ~1.5 percentage points.
County-Level City
Initial State: Monthly/bimonthly readings, severe data lag, NRW ~18%.
Action: Switched to NB-IoT meters, daily anomaly monitoring, zone comparisons.
Result:
- Meter reading cycle shortened to daily.
- NRW rate decreased to ~12%; leakage rate fell by ~2 percentage points.
These cases demonstrate that leakage governance cannot rely on a single large project. It requires a combination of transparent metering, clear zoning, controllable pressure, efficient work orders, and trustworthy data.
Outlook: Four Changes in Urban Pipe Network Governance by 2030
Process Indicators Over Outcome Indicators
Management will focus on DMA anomaly identification rates, night-time flow deviations, burst warning lead times, and repair closed-loop rates, rather than just final annual leakage percentages. Data authenticity and ledger continuity will be heavily assessed.
Dynamic Zoning Evolution
Traditional fixed DMA boundaries will evolve into dynamic units adjusted based on real-time pressure, flow, user activity, and historical risk data, reflecting actual operating conditions more accurately.
Integration with Energy and Carbon Goals
Leakage control will be included in energy-saving evaluations. Reducing leakage saves intake volume, treatment energy, and chemical dosing, directly contributing to dual carbon goals and optimized pump station energy consumption.
Resilient Pipe Networks
Facing climate change risks (heat, rain, drought), networks must possess rapid detection, isolation, recovery, and water quality safety capabilities. Burst risk maps and redundancy design will become standard planning components.
Conclusion: The Era of “Slow Variables”
Urban pipe network leakage governance is not a short-cycle project nor a simple equipment procurement task. It involves underground assets, metering systems, zoning boundaries, data quality, personnel organization, funding, policy assessments, and public service experience.
Behind keywords like leakage, zoning, and metering, the true determinant of effectiveness is whether the urban water system can develop continuously operating fine-grained management capabilities. As policy constraints tighten and smart water moves from construction to operations, the industry enters a stage emphasizing “slow variables”: data accumulation, process maturation, organizational adaptation, and effect validation.
For cities, reducing leakage rates is only the starting point. The long-term goal is a more transparent, reliable, lower-carbon, and resilient water supply pipe network system.

