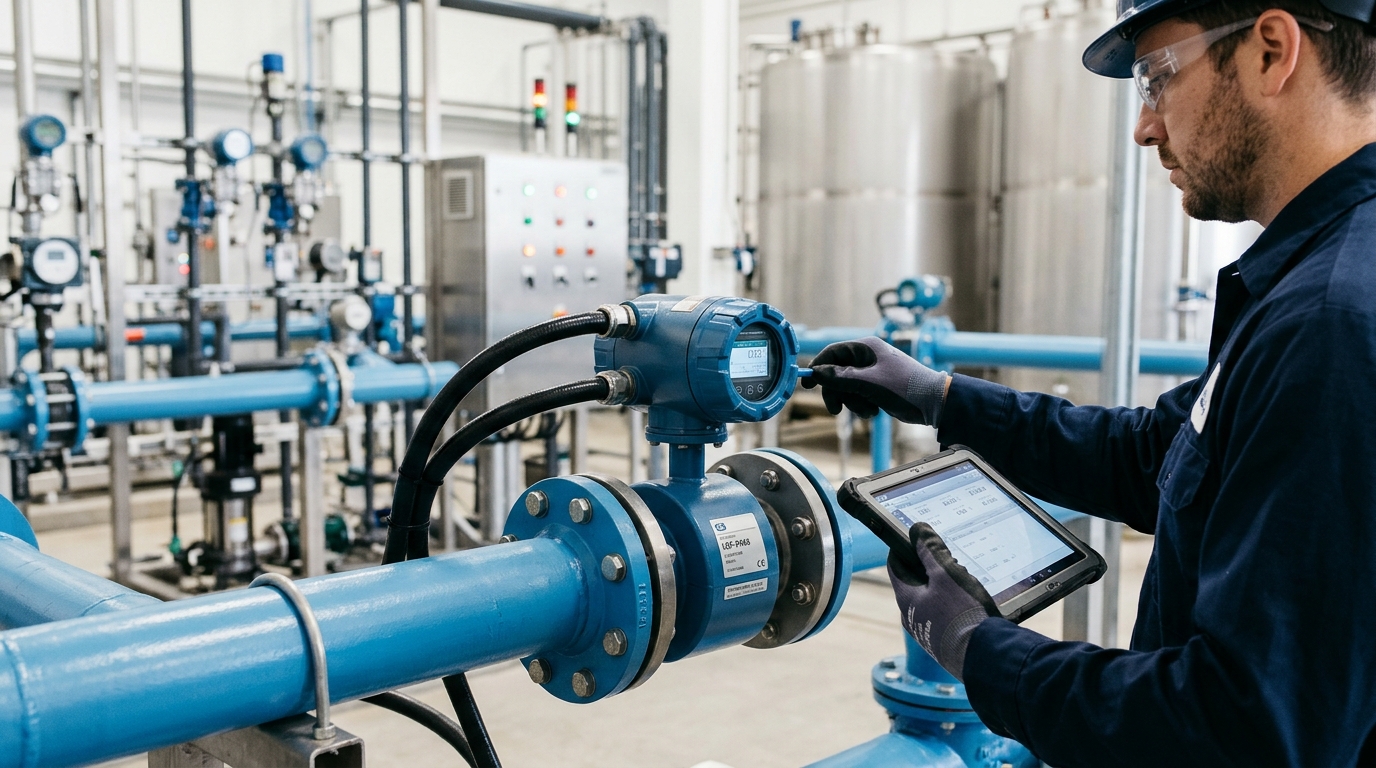
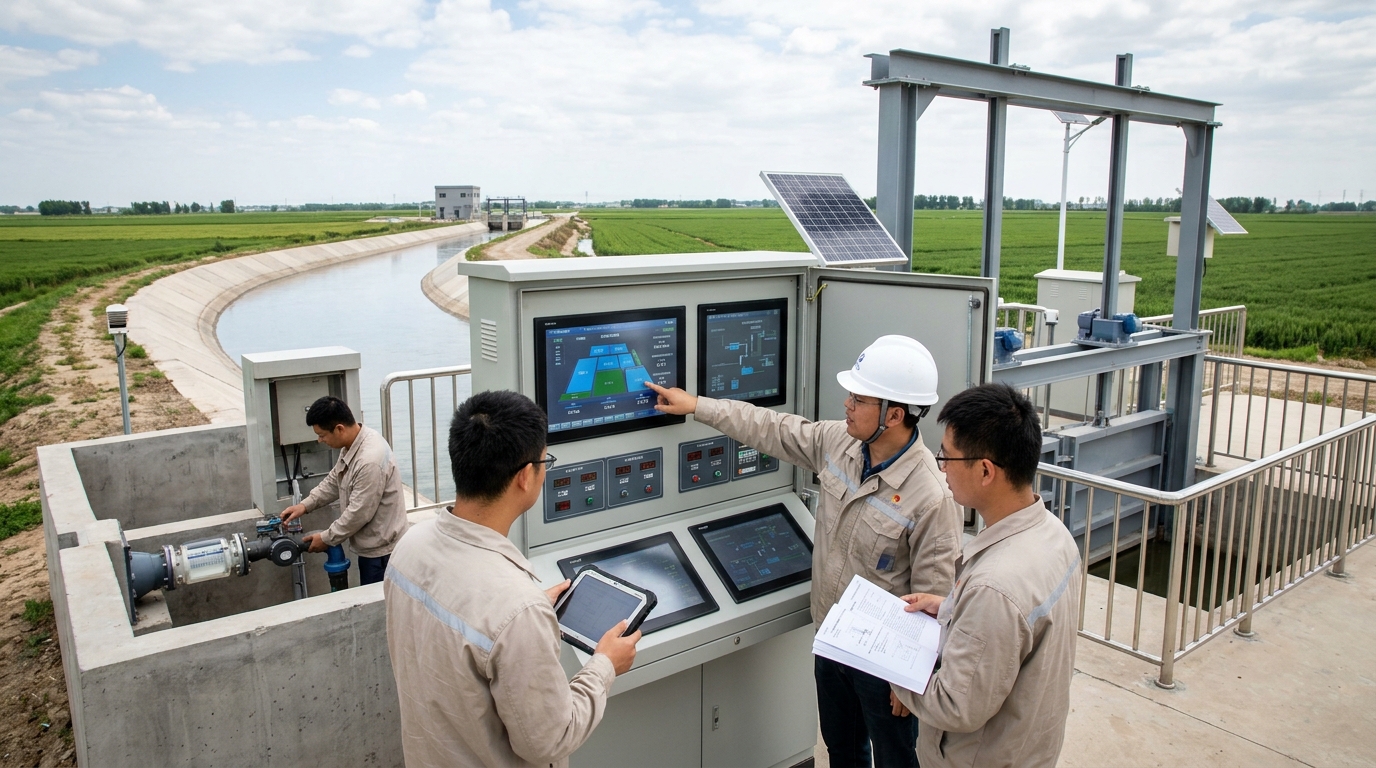
A Smart Water Resources Project in Practice: Doppler Flow Meter Application Case
Yicai Technology News: Recently, the non-contact Doppler flow meter monitoring project on a drainage trunk canal in a high-tech zone of a city in East China completed a 60-day trial run and passed acceptance. Addressing metering pain points in urban open drainage channels—low water levels, high sediment, flood-season floating debris, and difficult manual evidence collection—the project used radar Doppler velocity measurement, millimeter-wave water level measurement, and integrated camera linkage to continuously collect flow velocity, water level, cross-section flow rate, and on-site imagery. During the trial run, the main monitoring point cumulatively uploaded 86,400 valid data records, achieving a data completeness rate of 98.6%. Manual meter reading and on-site inspection frequency decreased significantly, providing a traceable data foundation for drainage scheduling, urban waterlogging early warning, and supervision of river discharge outlets.
Project Background: Open-Channel Flow Metering Moving from “Can Measure” to “Continuous and Trustworthy”
This monitoring point is located downstream of the influent interception trunk canal of the wastewater treatment plant in the high-tech zone. The canal section is a trapezoidal open channel with a bottom width of 1.2 m, side slope 1:1, maximum design water depth of 1.0 m, design flow rate of 0.8 m³/s, and peak flow under storm conditions of approximately 1.6 m³/s. Under normal dry-weather flow conditions, channel water depth is only 0.08 m to 0.55 m, and flow rates typically vary between 0.03 m³/s and 0.15 m³/s. Because this canal section conveys combined rainwater, wastewater, and a small amount of industrial wastewater from the district, flow data are used not only for wastewater treatment operations but also to identify mixed connections in the pipe network, illegal nighttime discharges, and flood-season overflow risks.
Before the project retrofit, the site had used a contact-type ultrasonic Doppler flow meter for monitoring. This solution performed relatively stably during high-flow periods, but revealed maintenance problems in environments with low water levels, high sediment, and abundant floating debris: probes were immersed in sewage for long periods, and sludge and fiber entanglement weakened echoes; during flood season, debris such as branches and plastic bags struck the probes, causing reading jumps; manual entry into the canal for cleaning and calibration occurred about 18 times per year, with each operation requiring temporary flow interruption and confined-space work protection, resulting in high safety costs. The original system had an average monthly online rate of about 82%, and data delays were generally more than 12 hours, making it difficult to meet the real-time scheduling requirements of the drainage platform.
Technical Challenges: Non-contact Measurement Must Simultaneously Solve Velocity, Water Level, and Video Evidence Issues
The first challenge: Non-contact measurement under low-velocity and shallow-water conditions. A radar Doppler flow meter calculates surface velocity by transmitting microwaves and receiving the Doppler frequency shift of echoes from the water surface; however, under dry-weather flow conditions, surface velocity can be as low as 0.05 m/s, and wind waves and raindrop interference can easily mask the true frequency shift. If the device only pursues a wide range, reading drift may occur in the low-velocity range; if excessive filtering is applied, it may weaken the characteristics of sudden flow changes during storms. The project required the velocity measurement range to cover 0.05 m/s to 5.0 m/s, with accuracy controlled within ±2% FS, while maintaining one-minute data refresh.
The second challenge: Converting water level to cross-sectional area. Open-channel flow is not obtained directly by multiplying velocity by a fixed cross-section; it varies with water depth, canal-bed sedimentation, and side-slope shape. Sediment thickness in this canal section fluctuates between 0.05 m and 0.12 m; if calculated only using the design cross-section, flow errors may exceed 10%. The equipment needed to measure water level synchronously, with a range of 0 m to 4 m and accuracy of ±5 mm, and to establish a local model of water level—area—wetted perimeter—hydraulic radius.
The third challenge: Regulatory scenarios required integrated camera linkage. A flow curve alone cannot determine the source of anomalies; the platform needs to know whether oil contamination, foam, floating debris, or external drainage hoses appear on the water surface at abnormal moments. Therefore, video must share unified timestamps with velocity and water-level data and maintain usable image quality under nighttime, rain/fog, and strong-light conditions.
Solution: Radar Doppler Velocity, Millimeter-Wave Water Level, and Integrated Camera Form a Closed Loop
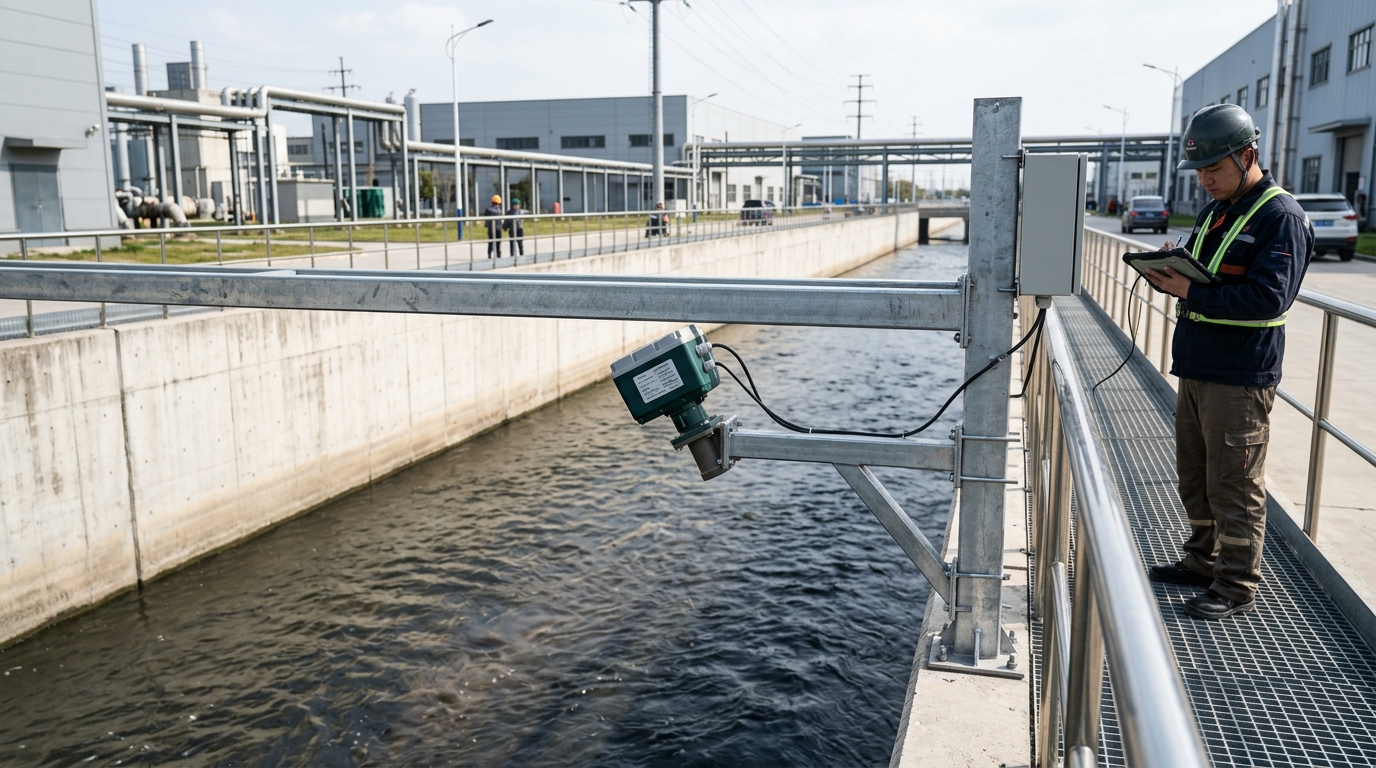
The final solution combined a non-contact Doppler velocity meter, a millimeter-wave level gauge, a starlight-class camera module, and an edge computing host mounted on a stainless-steel bracket at the top of the canal. The velocity meter was installed at a height of 2.2 m, with a beam depression angle of 35 degrees, a beam angle of 12 degrees, and a transmission frequency band of 24 GHz. It primarily measured surface velocity, and field calibration was used to obtain correction coefficients from surface velocity to cross-section average velocity. In the low-velocity range of 0.1 m/s to 0.3 m/s, the correction coefficient was 0.78; in the normal range of 0.3 m/s to 1.2 m/s, it was 0.82; and in the high-velocity range above 1.2 m/s, it was 0.88. The level gauge was installed laterally on the same bracket, using an 80 GHz millimeter-wave radar to measure the distance from the water surface to the equipment mounting surface and then convert it to the water level inside the canal.
The camera module used a 2-megapixel starlight-class sensor, supporting 1920×1080 resolution, 120 dB wide dynamic range, and 30 m infrared illumination. The lens was aimed at the water surface of the canal section, with key coverage of the velocity echo area. By default, the system uploaded a set of flow, water level, velocity, and snapshot images every 5 minutes. When the water level exceeded 0.65 m, velocity changed by more than 0.30 m/s within 10 minutes, or the platform received an abnormal dispatch instruction, it automatically switched to continuous snapshots at 1-minute intervals. The edge computing host included a trapezoidal cross-section model, moving-average filtering, raindrop interference recognition, and breakpoint-resumable transmission program, with 32 GB local cache. It could store data for up to 72 hours during communication interruption and automatically retransmit after recovery.
Implementation Process: 18 Days from Site Survey to Data Commissioning
The project started in early September 2024 with an implementation period of 18 days. The first 7 days were for site survey; engineers re-measured the canal cross-section and confirmed the actual bottom width as 1.21 m, side slope 1:1.03, and average sediment thickness 0.09 m. The survey also recorded power supply conditions, communication signal strength, bracket foundation bearing capacity, and lightning-protection grounding conditions. Because stable municipal power was unavailable on site, the solution used a 60 W monocrystalline solar panel combined with a 100 Ah lithium iron phosphate battery, requiring equipment operation to be maintained even after 7 consecutive days of rain. Communication used 4G as the primary link and Ethernet as the backup link, and data were connected to the municipal comprehensive drainage supervision platform via the MQTT protocol.
Equipment installation was completed from Day 8 to Day 10. The bracket was made of 304 stainless steel, and foundation anchor bolts had a tensile grade of no less than 8.8. The measured equipment grounding resistance was 8.6 Ω, meeting the requirement of no more than 10 Ω. The mounting surfaces of the velocity meter and level gauge were leveled, with errors controlled within 0.5 degrees. The camera angle was adjusted in three rounds, ultimately making the image center cover about 70% of the radar beam illumination area while avoiding direct streetlight glare. Data commissioning was conducted from Day 11 to Day 17; technicians installed a manual staff gauge in the canal section and used a portable electromagnetic flow meter to compare readings at multiple cross-sections, recording water level, velocity, flow rate, and image timestamps. On Day 18, the system entered continuous trial operation.
Commissioning and Calibration: Verifying Non-contact Measurement Accuracy through Multi-condition Comparison
The calibration phase included 12 sets of operating conditions, covering low water level, normal water level, high water level, and rapid storm-induced rise and fall. The low-water-level condition had a water depth of 0.08 m and surface velocity of 0.06 m/s; the normal-water-level condition had a water depth of 0.32 m and surface velocity of 0.45 m/s; the high-water-level condition had a water depth of 0.78 m and surface velocity of 1.32 m/s; and the storm condition simulated flow increasing from 0.12 m³/s to 1.48 m³/s within 6 hours. For each condition, radar Doppler velocity, millimeter-wave water level, manual staff gauge readings, portable electromagnetic flow meter readings, and camera images were recorded simultaneously.
Comparison results showed that during the 7-day continuous calibration, the average absolute deviation of water level was 4 mm, with a maximum deviation of 7 mm; the average absolute deviation of velocity was 3.1%, with a maximum deviation of 5.8%; and the average absolute deviation of flow converted by the cross-section model was 4.6%, with a maximum deviation of 6.8%. Under low-velocity conditions, the system avoided false velocity reports when the water surface was still by adding raindrop recognition and echo-strength threshold judgment. Under high-velocity conditions, by retaining the original Doppler frequency-shift curve, no obvious peak clipping occurred. The project also established a sedimentation review mechanism: each month, sediment changes were judged based on the offset of the water level–flow relationship curve; when the offset exceeded 8%, manual dredging or cross-section re-measurement was triggered.
Operational Effect: Flow Data Completeness Rate Increased to 98.6%
During the 60-day trial operation, the main monitoring point generated a total of 86,400 valid data records, with a data completeness rate of 98.6%, a significant improvement over the approximately 82% of the original contact-type solution. The system triggered alarms 23 times cumulatively; 4 were confirmed as false alarms after review, and 19 were valid anomalies. Valid anomalies included 6 storm overflow warnings, 9 abnormal nighttime flow increases, and 4 water-surface floating debris or suspected drainage hose events. Through linkage of velocity, water level, and integrated camera, the platform shortened anomaly confirmation time from an average of about 4 hours to less than 30 minutes. On-site inspection frequency was adjusted from 3 times per week to 1 time every two weeks, and the focus of each inspection shifted from probe cleaning to checking the bracket, lens, and power supply status.
During one rainfall event, local accumulated rainfall over 6 hours was 26.4 mm. At the monitoring point, water level rose from 0.28 m to 0.81 m, velocity increased from 0.32 m/s to 1.12 m/s, and peak flow reached 1.48 m³/s. The system identified a rapid velocity increase 18 minutes after the rain began and linked with the camera to capture oil film and foam bands on the water surface. Based on this, the platform dispatched downstream pump stations and gates in advance, issuing an overflow warning approximately 2 hours earlier than the original manual meter-reading method. Another nighttime anomaly occurred at 1:20 a.m., when water level was 0.21 m, velocity was 0.18 m/s, and flow was 0.07 m³/s, 64% higher than the average for the same time period over the previous 7 days. The camera image found drainage from a blue hose at the canal edge, and regulatory authorities subsequently conducted an on-site investigation.
Case Value: From Single Metering to Drainage Scheduling and Supervision Linkage
The core value of this project lies not in a single device replacing manual meter reading, but in integrating velocity, water level, flow, and camera imagery into the same data link to form a closed loop of “measurement—identification—evidence collection—dispatch”. For drainage management departments, non-contact measurement reduces the frequency of personnel entering open channels, manholes, and overflow outlets, thereby lowering confined-space work risks. For wastewater treatment plants, continuous flow data help stabilize influent load assessment and reduce process impacts caused by sudden flow changes during storms. For pollution discharge supervision, video evidence improves traceability of abnormal flow events, making flow curves no longer isolated numbers.
The project also provides reproducible parameters for similar scenarios: for trapezoidal open channels, wide and shallow flow regimes, and dry-weather low water levels, the installation height of a radar Doppler velocity meter should be controlled at 2.0 m to 2.5 m, and the depression angle should be between 30 degrees and 40 degrees. The level gauge and velocity meter should share the same cross-section model and coordinate reference. The camera module should cover the radar illumination area and have night illumination and wide dynamic range capabilities. For urban drainage channels with high sediment content and abundant floating debris, the system should retain original frequency-shift and echo-strength data for later review. Project acceptance also required the platform to have breakpoint-resumable transmission, timestamp consistency, and alarm review functions to ensure that non-contact measurement data can enter the business decision-making process.
Outlook: Non-contact Flow Monitoring Extending Toward Edge Intelligence and Standard Coordination
As urban drainage pipe networks, river discharge outlets, and sponge city construction continue to advance, the demand for open-channel flow monitoring is shifting from “whether data exists” to “whether data can be used for dispatch, supervision, and operation and maintenance”. Non-contact Doppler flow meters, by avoiding probe immersion and reducing maintenance intensity, are applicable in low-water-level, high-pollution, and flood-season impact scenarios. Future engineering applications will further strengthen edge intelligence, for example, using video recognition to identify water-surface color, floating-debris type, and abnormal drainage behavior; using Doppler spectrum recognition to distinguish raindrop interference from true velocity changes; and using a joint water level–velocity–flow model to automatically correct sedimentation and cross-section changes.
At the industry level, unified specifications are still needed for data quality, interface protocols, and operation and maintenance standards. Drainage monitoring equipment involves multiple parameters such as velocity, water level, flow, power supply, communication, video, and lightning protection. If different projects define their own accuracy, timestamps, and alarm thresholds, platforms will find it difficult to compare data horizontally. This case demonstrates that an engineering solution must include equipment parameters, field calibration, platform access, and operation and maintenance systems in acceptance. Yicai Technology believes that non-contact measurement, integrated camera linkage, and edge computing are not simply stacked functions, but a data foundation for observability, traceability, and decision-making in the digital operation of urban water systems. Only when velocity, water level, flow, and imagery can jointly serve drainage dispatch and supervision can flow meters truly upgrade from metering tools to urban governance nodes.