Doppler Flowmeter Routine Maintenance and Troubleshooting Manual
A practical guide to ensuring accurate flow data through installation, commissioning, and maintenance.
Introduction: The Core of Doppler Flow Meter Operation
In scenarios such as urban drainage, irrigation district metering, river monitoring, and industrial open channel discharge, the Doppler flow meter is becoming one of the crucial devices for flow monitoring. Its typical working principle is to acquire surface or water body motion information via the Doppler effect, and then calculate instantaneous and cumulative flow by combining water level, cross-sectional parameters, and flow velocity conversion models. Compared with traditional contact measurement, non-contact measurement is more suitable for sewage, water bodies with impurities, corrosive water bodies, and channels where manual well entry or flow interruption is inconvenient.
However, in actual engineering projects, whether the equipment can measure accurately depends not only on the instrument itself but also on the installation location, cross-sectional conditions, parameter configuration, water level calibration, post-installation maintenance, and fault response. In particular, with the introduction of integrated cameras, flow monitoring is no longer just a single numerical output; it can simultaneously retain video footage, staff gauge images, floating debris status, and on-site working conditions, providing a basis for data verification. This article organizes a practical and implementable guide for Doppler flow meter operation from four dimensions: installation steps, commissioning methods, routine maintenance, and common troubleshooting.
I. Pre-Installation Preparation: Confirm Measurement Boundaries First
Key Principle:
If the channel itself has strong backflow, drops, eddies, gate throttling, or sudden cross-sectional changes, any high-precision equipment will struggle to output stably.
Site Selection Criteria
- Straight Reach: Upstream ≥ 5 times channel width; Downstream ≥ 2 times channel width.
- Obstacles: If bends, pump stations, weirs, or confluences exist, extend straight reach to 8–10 times channel width.
- Measurement Range: Water level (0.1m–6m), Flow velocity (0.05m/s–10m/s), Channel width (0.3m–8m).
Equipment Verification
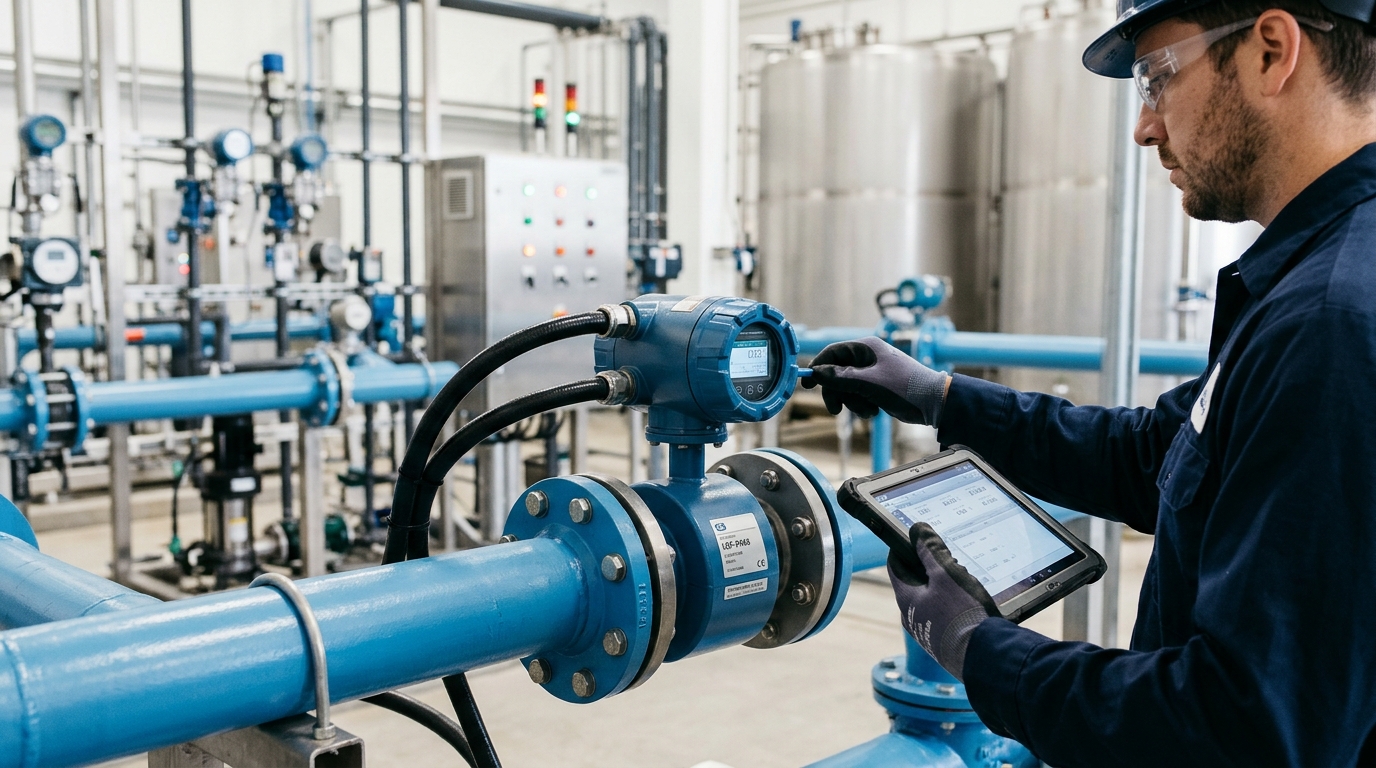
Before installation, verify the complete equipment list. A typical configuration includes a Doppler surface velocity radar or ultrasonic Doppler probe, water level sensor, data acquisition terminal, power supply unit, communication module, bracket, and lightning protection components.
For visual operations, add an integrated camera unit (≥2 megapixels) supporting low illumination and timed capture. Essential tools include tape measures, laser rangefinders, inclinometers, spirit levels, and waterproof connectors.
II. Installation Steps: Coordinated Layout
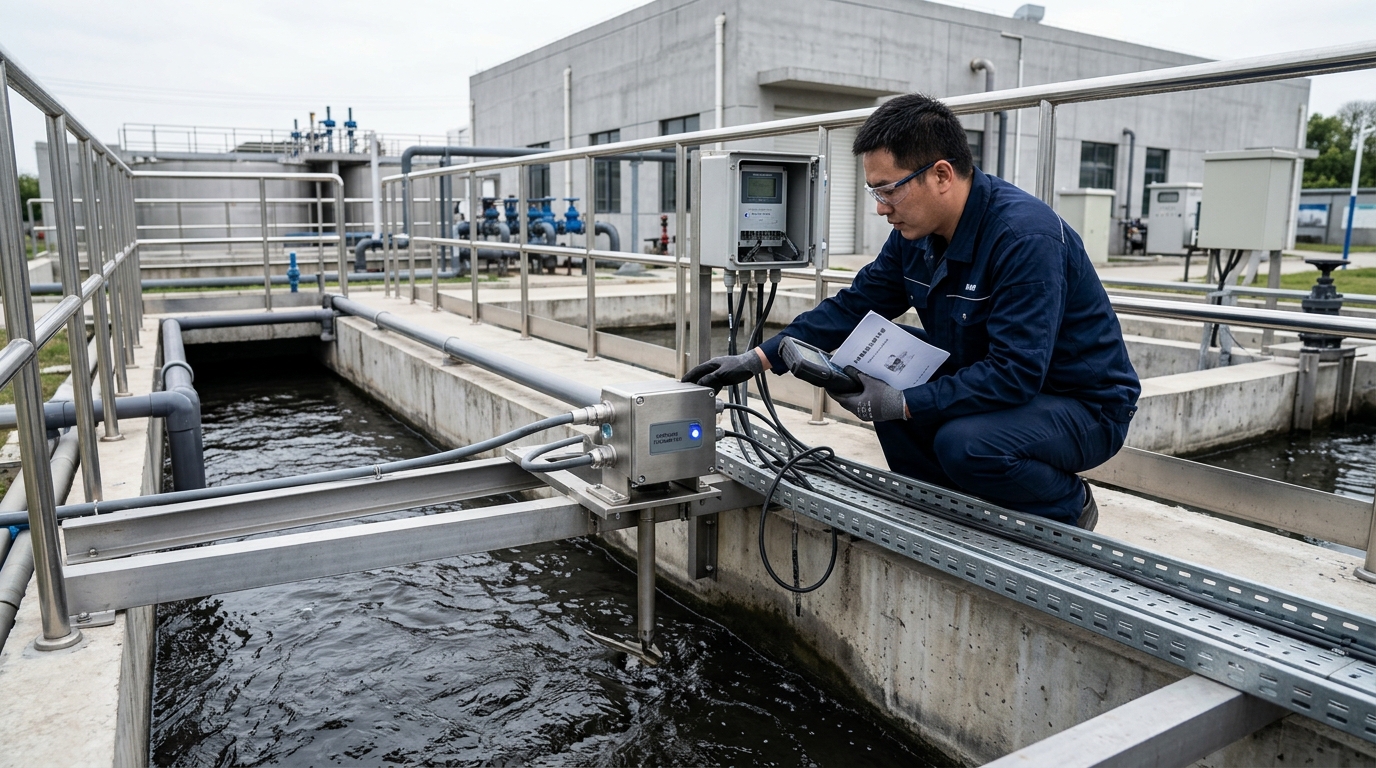
Probe Placement
Face the main flow line directly. Avoid dead water areas near banks. Installation height above water: 0.5m–4m (recommended 1.2m–2.5m). Depressed angle: ~45°.
Water Level Sensor
Pressure type: Use stilling well. Radar/Ultrasonic: Install vertically downward. Ensure zero point matches channel bottom elevation.
- Determine Cross-Section & Bracket: Ensure the probe covers the main flow line. Avoid pedestrian obstruction and electromagnetic interference.
- Install Bracket/Pole: Use hot-dip galvanized or stainless steel. Ensure stability against wind and flood impact. Outdoor equipment should be IP65/IP67 rated.
- Mount Doppler Probe: Aim downstream or upstream (avoid transverse). Verify depression angle (30°–60°, recommended 45°) with an inclinometer.
- Install Water Level Sensor: Protect from waves and debris. Calibrate zero point carefully.
- Configure Integrated Camera: Field of view must cover staff gauge and main flow. Ensure clear visibility of foam, debris, and siltation.
- Power & Protection: Solar + Battery (e.g., 30W panel, 40Ah battery). Grounding resistance ≤ 10 ohms. Install surge protectors.
III. Commissioning Methods: Linking Parameters into Flow
"Commissioning is not 'install and use,' but a process of continuously adjusting parameters to approach the actual on-site hydraulics."
The Critical K-Factor
Doppler meters measure surface velocity ($V_s$), but calculation requires average velocity ($V_{avg}$). The relationship is defined as:
Where K (surface velocity coefficient) typically ranges from 0.75 to 0.95. It depends on channel shape, roughness, and depth.
Commissioning Workflow
- Self-Test: Check voltage, communication, time sync, and reporting cycles.
- Water Level Calibration: Zero-point and known point calibration. Error should be within ±1cm or ±0.5%.
- Cross-Section Input: Accurately input bottom width, side slopes, and pipe diameters. Update if siltation occurs.
- K-Value Correction: Compare with portable meters or ADCP at low, medium, and high water levels. Adjust K accordingly.
- Filtering & Alarms: Enable median filtering. Set thresholds (e.g., velocity < 0.03m/s as invalid).
IV. Routine Maintenance: Maintaining Data Credibility
| Frequency | Key Tasks |
|---|---|
| Daily (Remote) | Check data integrity (>98%), voltage, signal strength, and continuous curves. |
| Weekly | Clean camera lens; check solar panel for dust/bird droppings (clean if efficiency drops >5%). |
| Monthly | Inspect probe radome, water level tubes, bracket bolts, and cable waterproofing. Clean probe window with soft cloth. |
| Quarterly | Manual comparison test. If error >±8%, review K-value and cross-section. Re-measure if bed elevation changes >5cm. |
| Pre/Post Flood | Check pole stability, grounding, battery capacity, and clearing debris. Post-flood: inspect for impact damage and sensor drift. |
V. Common Troubleshooting Guide
Fault 1: No Data / Interruption
Causes: Low battery (<10.8V), SIM card issues, antenna disconnection, or fuse blown.
Action: Check power supply, reboot remotely, verify RS485 wiring polarity.
Fault 2: Velocity Zero or Low
Causes: Water level below probe range, incorrect angle, beam obstruction, or threshold set too high.
Action: Verify installation geometry, clean probe window, lower minimum velocity threshold.
Fault 3: Negative Velocity
Causes: Reverse flow due to tides/gates, or parameter direction mismatch.
Action: Check flow direction settings vs. physical installation. Distinguish real reverse flow from errors.
Fault 4: Data Jumps / Fluctuations
Causes: Wind/waves, foam reflection, floating debris, or loose brackets.
Action: Enable outlier rejection filters. Tighten bolts. Use camera to identify external interference.
Fault 5: Abnormal Water Level
Causes: Stilling well blockage, bubbles, or radar blind zone entry.
Action: Flush stilling well. Check sensor alignment. Verify staff gauge reading via camera.
Fault 6: Camera Black Screen / Blur
Causes: Power loss, dirty lens, condensation, or IP conflict.
Action: Clean lens/scale. Adjust fill light angle to avoid reflection. Check storage and network.
VI. Typical Cases & VII. Conclusion
Case 1: Urban Stormwater Outlet
Used 24GHz radar + pressure sensor. Foam caused jumps. Solution: 5-point median filter + alarm-linked snapshots. Result: 99.2% data integrity, ±6% error.
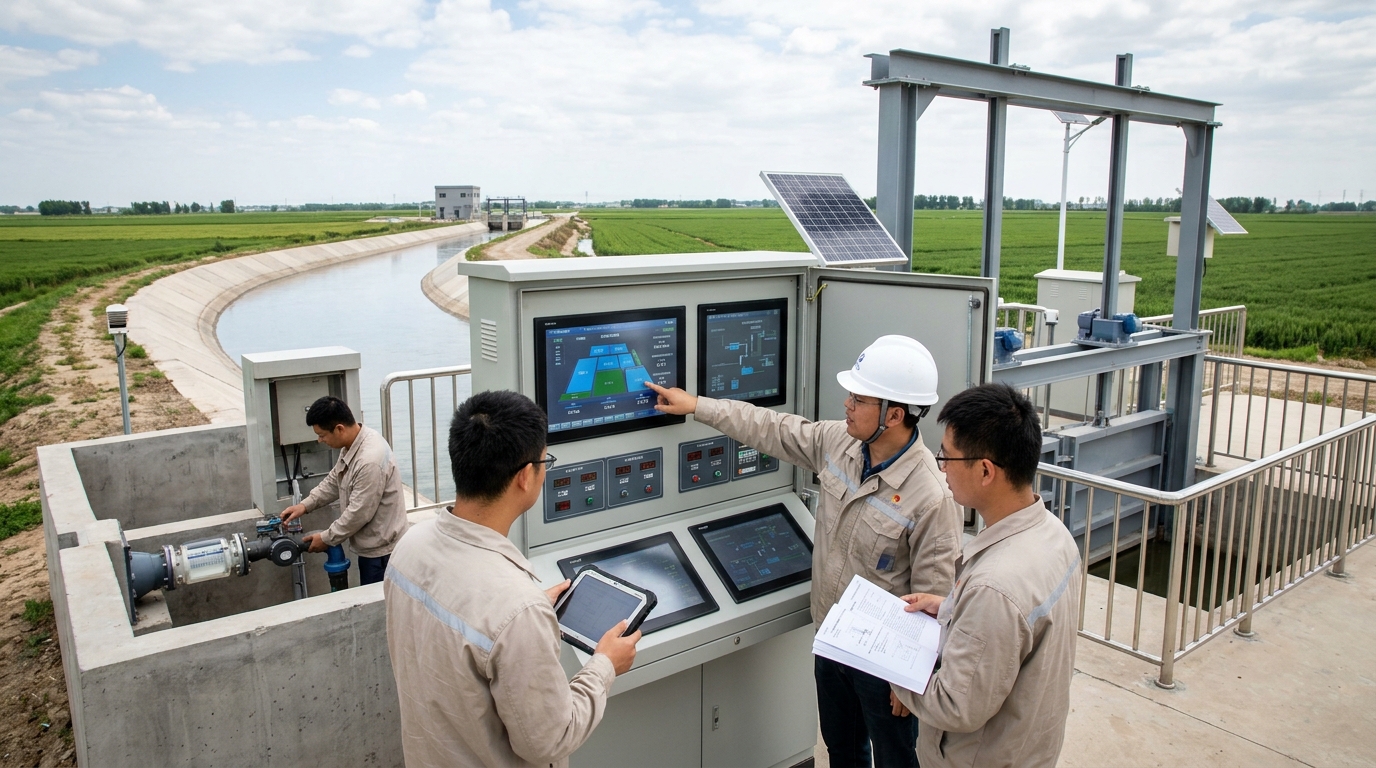
Case 2: Irrigation Canal
Trapezoidal channel with varying depths. Solution: Segmented K-values (0.80 low, 0.85 mid, 0.88 high). Result: Improved coincidence with gate dispatch records.
With increasing demand for open channel monitoring, Doppler flow meters are evolving towards multi-source perception fusion. The integration of radar/ultrasonic velocity, water level sensors, and AI-driven cameras allows for robust identification of foam, debris, and reverse flows.
For engineering and O&M units, success lies not in chasing single parameters, but in establishing standardized processes: precise site selection, geometric recording, manual comparison during commissioning, periodic maintenance ledgers, and closed-loop troubleshooting. Only by refining these steps can Doppler flow meters provide stable, verifiable data for urban drainage, irrigation, and environmental governance.