Correct Usage of Drainage Network Monitoring under Complex Operating Conditions
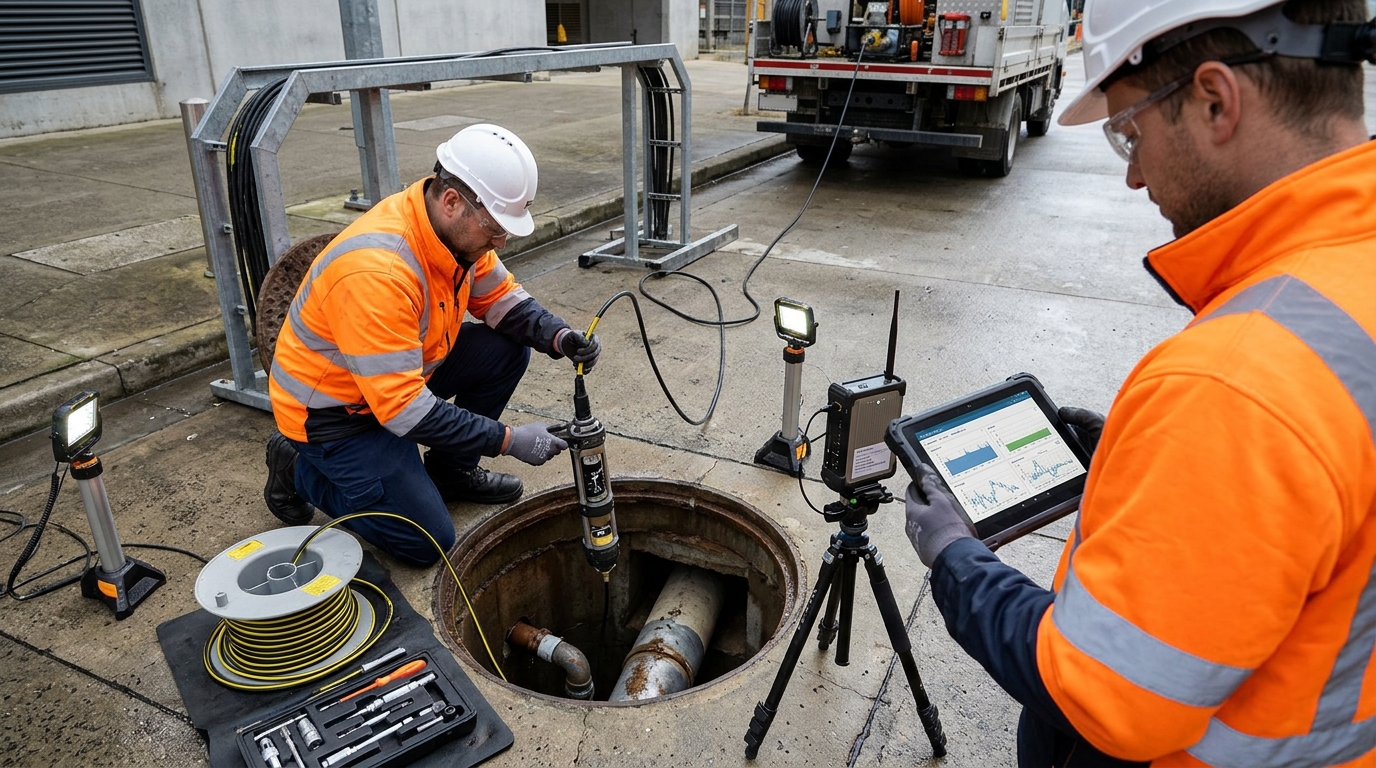
I. Introduction: Urban Drainage Network Monitoring Enters the Refined Operations and Maintenance Phase
Urban drainage systems have long faced operational pressures described as “invisible underground, difficult to predict before rainfall, and difficult to trace after overflow.” With increasing frequency of extreme rainfall events, compounded by misconnections and sedimentation in old urban drainage networks, traditional flood prevention methods that rely on manual patrols, pump station operator experience, and post-rain emergency response can no longer meet the requirements for refined governance. The core value of urban drainage network monitoring lies in transforming water level, flow, rainfall, and overflow data into operational evidence that supports early warning, dispatching, and post-event review.
From industry practice, water level monitoring answers “where the water is and how high it is,” flow monitoring answers “how fast the water moves and whether capacity is exceeded,” and flood prevention warnings combine water level, flow, rainfall, and pump station status into risk judgments. For industry observers such as Yicai Technology, a truly implementable drainage network monitoring project is not merely installing sensors, but forming an executable process for installation, commissioning, maintenance, and fault troubleshooting.
This guide focuses on practical operations for drainage network monitoring, covering monitoring point layout, water level and flow equipment installation, commissioning and calibration, daily maintenance, fault troubleshooting, and case review, with emphasis on operability, data reliability, and threshold management in flood prevention scenarios.
II. Monitoring Points and Equipment Selection: Aligning Water Level, Flow, and Flood Prevention Thresholds
Strategic Point Layout
Drainage network monitoring points should be prioritized at flood-prone spots, trunk pipe junctions, pump station forebays, detention basins, overflow outlets, dense manhole sections, and downstream receiving water body inlets. It is generally recommended that each drainage zone install at least one water level monitoring point and one flow monitoring point at a critical node, and add overflow alarm points in low-lying road sections, underpasses, and old combined sewer areas. The number of monitoring points should not be expanded blindly; it should be dynamically adjusted according to pipe network topology, catchment area, and rainfall event review results.
Water Level Monitoring Technologies
- Radar Level Meters: Suitable for manhole-top installation and non-contact measurement; common measurement ranges are 0 to 10 m or 0 to 15 m, with accuracy of about ±1 cm or ±0.1% FS. Ideal for mixed sewage and stormwater conditions.
- Submersible Level Sensors: Lower cost, but probes can be covered by sediment, grease, and floating objects, requiring protective covers and regular cleaning.
- Ultrasonic Level Meters: Require attention to the effects of manhole steam, foam, and temperature changes on echoes.
Flow Monitoring Considerations
Flow monitoring must distinguish full-pipe and partially full conditions. Open channels and partially full stormwater pipes can use Doppler flow meters, level-velocity models, or weir/flume methods. Full-pipe sewage conduits commonly use electromagnetic flow meters or clamp-on ultrasonic flow meters. Doppler flow meters have requirements for sediment concentration, bubbles, and flow regime; installation locations should avoid hydraulic drops, bends, and confluences. Level-flow models depend on cross-section dimensions, slope, roughness, and sedimentation condition; initial manual flow calibration is required, with error typically controlled within 10%, and 5% to 8% for critical nodes.
Flood Prevention Thresholds: Three-Level Response Approach
- Level 1 Warning: Water level reaches 0.5 m below pipe crown, flow reaches 80% of design capacity, rainfall intensity reaches 30 mm/h, or cumulative rainfall reaches 50 mm.
- Level 2 Control: Water level is 0.2 m below ground, flow reaches 100% of design capacity, or pump station forebay exceeds the low-water-level setpoint.
- Level 3 Emergency: Ground overflow occurs, water level exceeds the lower edge of the manhole cover, flow exceeds 120% of design capacity, or continuous backflow occurs.
Note: Thresholds must be matched to ground elevation, pipe diameter, catchment area, and pump drainage capacity; fixed values should not be applied simplistically.
III. Installation Steps: Practical Process from Field Survey to Sensor Mounting
Step 1: Field Survey & Data Verification
Before installation, check manhole coordinates, invert elevation, cover type, pipe diameter, slope, flow direction, historical ponding, and overflow records. For radar meters, confirm opening diameter and bracket space. For flow meters, ensure upstream straight section meets 10 pipe diameters upstream and 5 downstream. If full-pipe installation fails, consider bypasses or temporary calibration schemes.
Step 2: Confined-Space Safety Preparation
Implement ventilation, gas testing, and two-person watch. Oxygen ≥ 19.5%; H₂S < 10 ppm (safe work threshold). Use explosion-proof equipment, fall protection nets, safety ropes, and warning barriers. Additional lighting and traffic guidance are required during rain or night operations.
Step 3: Sensor Installation Precision
Radar: Top bracket/beneath cover. Antenna perpendicular to water surface (deviation ≤ 3°), distance from wall ≥ 0.3 m.
Submersible: Fixed 0.2–0.3 m above bottom, avoiding sediment zones.
Doppler: Bottom of straight channel, 0.1–0.2 m above bottom.
Electromagnetic: Full-pipe only. Electrode axis aligned with sediment movement. Grounding resistance ≤ 4 ohms.
Step 4: Power, Communication & Protection
Use lithium batteries (3–5 year life), solar panels (10–20 W + 20–50 Ah battery), or mains power. Test signal strength on-site: RSRP > -110 dBm, SINR > -3 dB. Enclosure rating IP68 (or IP67 for interfaces). Avoid metal obstruction of antennas.
IV. Commissioning Methods: Zero Point, Range, Communication, and Data Quality Verification
Datum Alignment and Calibration
Water level data must be converted to water surface elevation using a unified datum (e.g., 1985 National Height Datum). Inconsistent datums cause platform contradictions like “normal level but overflow displayed.” Radar meters require blind zone and range configuration; verify with tape/laser meter (error < 2 cm, < 1 cm for critical nodes). Submersible sensors need zero correction and vent cable checks. Records must include empty/full well values, elevations, ranges, units, sampling periods, and thresholds.
Flow Commissioning
Enter pipe inner diameter, slope, roughness, and sediment thickness for level-flow models. Compare with current meters or volumetric methods. Collect data continuously for 72 hours, correlating with rainfall and pump records. If error > 10%, check sedimentation, water level drift, probe fouling, and parameters. Persistent low flow often indicates reduced cross-section or probe coverage.
Communication and Platform Testing
Sampling frequency: Water level every 1–5 min, flow every 5–15 min (increase to 1 min during rain). Verify online rate (>95%), completeness (>98%), and alarm delay (<30 sec–5 min). Test alarm linkage via SMS/app/duty terminals using simulated combinations of water level, flow, and rainfall.
V. Daily Maintenance: Cycles, Dredging, Power Supply, and Data Backup
| Cycle | Key Activities |
|---|---|
| Daily | Remote inspection: Online rate, battery level, signal, data jumps, alarm status. |
| Monthly | On-site: Clean debris, check brackets, tighten components, verify water level zero. |
| Quarterly | Deep maintenance: Dredging, flow calibration, threshold review, sediment thickness measurement. |
| Annual | System assessment: Lightning grounding tests, battery assessment, firmware upgrades, spare parts replacement. |
Equipment Specific Maintenance
- Water Level: Clean radar antennas of mist/oil. Inspect submersible covers for blockages. Measure sediment quarterly; dredge if sediment exceeds 5–10% of pipe diameter to prevent distorted data.
- Flow: Remove algae/oxides from Doppler probes. Check electromagnetic liners/electrodes. Review sediment impact on level-flow models. Clear floating debris from open channels/weirs.
- Power/Data: Set low-voltage warnings (e.g., single cell < 3.2 V). Clean solar panels before rainy season. Retain raw/corrected data and O&M orders for 3–5 years. Avoid firmware upgrades during heavy rain.
VI. Common Fault Troubleshooting: Water Level Drift, Flow Anomalies, and Alarm False Positives
Water Level Drift
Symptoms: Curve rises slowly without visible ponding.
Causes: Sediment accumulation, zero offset, temperature, bracket sinking, diaphragm contamination.
Troubleshooting: Verify actual level -> Measure distance to bottom -> Check fixing -> Compare historical curves with rainfall. Enable smoothing filters cautiously to avoid delaying warnings.
Flow Anomalies
Persistently Low: Probe fouling, sedimentation, wrong parameters, signal obstruction.
Sudden High: Overflow, bypass, external inflow, bubbles, oversized parameters.
Action: Recalibrate annually before flood season. Switch sensor types (e.g., Doppler to Electromagnetic) if sediment/bubbles interfere.
Device Offline
Check Sequence: Battery exhaustion -> SIM/Antenna status -> Signal strength -> Module hang-ups.
Environment: Metal structures, closed covers, and underground attenuation affect communication. Add external antennas or switch to LoRa gateways if needed. Monitor reboot counts and signal metrics.
Alarm False Positives/Misses
False Positives: Thresholds too low, drift, ignored runoff lag, missing pump status.
Missed Alarms: Thresholds too high, equipment faults, data gaps, wrong zone division.
Solution: Use dynamic thresholds (tighten in wet season based on antecedent rain). Add rise-rate indicator (e.g., >0.3 m in 10 mins). Include predicted risk and pump info in alerts.
VII. Case Observations: Quantified Effects of Flood Prevention Monitoring Renovation
Case 1: Southern City Old Urban Area Renovation
In a project covering ~260 manholes, 18 trunk nodes, and 6 pump stations, 80 radar level meters, 25 flow devices, and 12 rain gauges were deployed. Challenges included missing invert elevations, weak signals in metal chambers, and sediment-induced datum errors.
- Commissioning: Verified elevations to unified datum. Compared flow with portable meters for 72 hours. Error reduced from 18% to <8% after dredging.
- Thresholds: Tiered based on pipe crown/ground/pump capacity (Level 1: 0.5m below ground; Level 2: 0.2m below; Level 3: Overflow/>120% flow).
- Results (6 Months): Warning lead time increased from 10–20 mins to 30–60 mins. On-site response shortened from 45 mins to 12 mins. False alarm rate dropped from 15% to 4% due to zero correction and dynamic thresholds.
Case 2: Northern Industrial Park Detention Basin
Using 12m range radar and Doppler flow meters (5-min sampling), initial flow error exceeded 20% due to basin sediment and inlet bubbles. Solutions included raising probes, installing anti-vortex plates, cleaning deposits, and recalibrating cross-sections, reducing error to <8%. This highlights the importance of hydraulic condition management in complex nodes like forebays and drop manholes.
VIII. Outlook: From Single-Point Monitoring to a Closed Loop for Drainage Flood Prevention Dispatch
Future urban drainage monitoring will evolve from “visible data” to “dispatchable, reviewable, and optimizable” systems. Integration of water level, flow, rainfall, pump stations, gates, and video with GIS, hydraulic models, and weather forecasts will enable root-cause analysis (upstream inflow vs. downstream backwater vs. pump capacity vs. sedimentation).
Standardization is key. The industry requires unified device codes, elevation datums, quality indicators, and fault handling processes. Performance assessments should focus on online rate, data completeness, alarm accuracy, and maintenance timeliness rather than just device count. Old urban areas should iteratively optimize points based on census and renovation plans to avoid “installed but unused” assets.
Long-term value extends beyond storm response to daily O&M. Persistent high levels indicate blockages; abnormal flow declines suggest sedimentation or infiltration; anomalous rainfall-overflow relationships expose misconnections. Continuous data accumulation shifts systems from passive emergency response to proactive governance, supporting resilient city construction.

