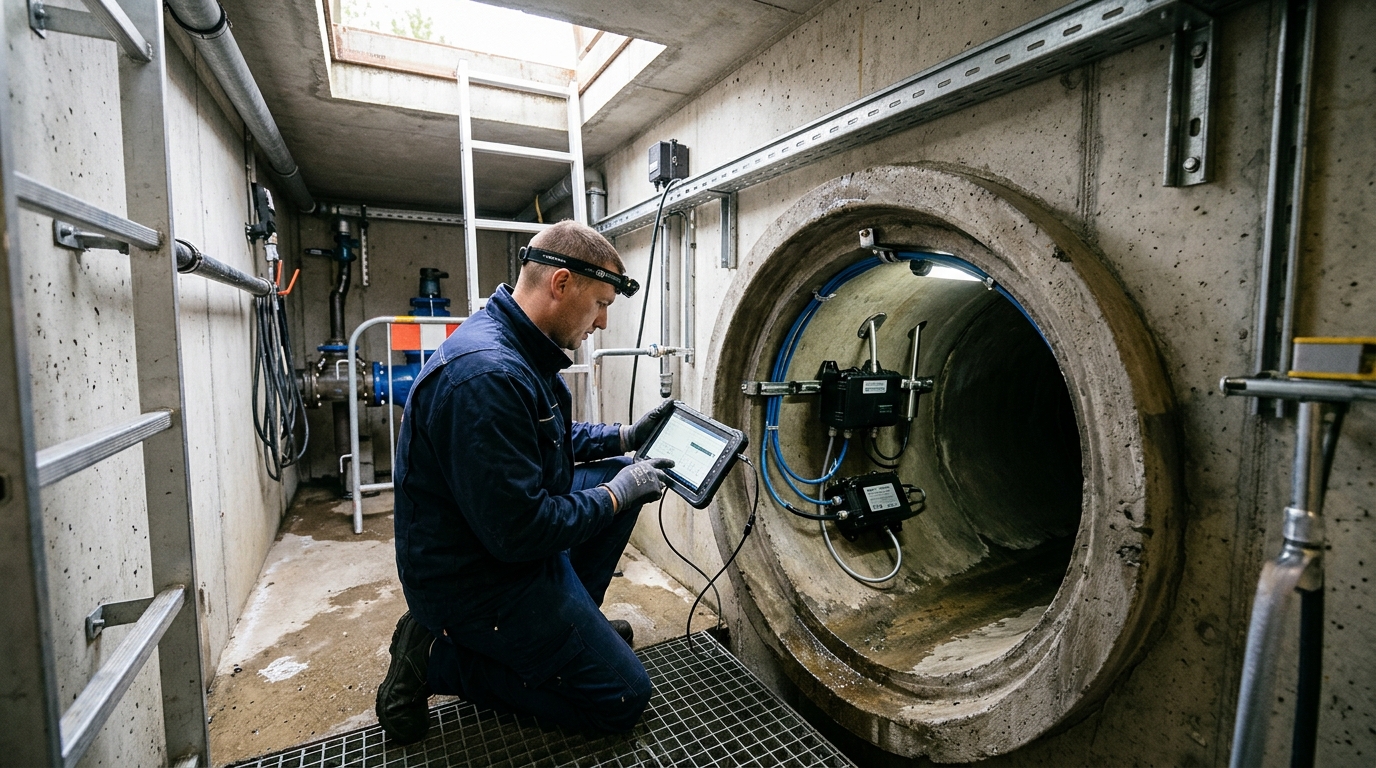
Correct Use of Drainage Network Monitoring under Complex Operating Conditions
A practical guide to installation, commissioning, maintenance, and troubleshooting for proactive urban waterlogging prevention.
As the risk of urban waterlogging increases and the demand for refined management of drainage pipe networks grows, drainage network monitoring is shifting from reactive response to proactive early warning. Multi-source data such as liquid level, flow rate, rainfall, and video jointly constitute the foundation for sensing the operating status of drainage systems, providing a basis for waterlogging prevention dispatching, network diagnosis, and O&M decision-making. The following presents a practical implementation guide covering installation procedures, commissioning methods, routine maintenance, and common fault troubleshooting.
1. Composition and Applicable Scenarios
Drainage network monitoring typically consists of front-end sensing devices, communication transmission, edge computing, a data platform, and business applications. Front-end devices mainly include level sensors, flow meters, rain gauges, water quality sensors, manhole cover status sensors, and video surveillance. Liquid level is used to assess pipe network fullness and sedimentation/clogging risks; flow rate is used to identify inflow and infiltration, misconnections and cross-connections, and downstream bottlenecks; rainfall linked with level and flow can be used for waterlogging early warning.
Common Monitoring Scenarios
- Trunk pipe nodes
- Waterlogging-prone locations
- Pump station forebays
- Storage/retention basins
- Overflow manholes & stormwater inlets
- Underpasses & industrial park outfalls
Technical Specifications
Diameter DN300-DN2000:
Level monitoring range: 0–5 m or 0–10 m, accuracy ±1 cm.
Flow Solutions:
Electromagnetic, Doppler, ultrasonic, pressure-type, or weir-and-flume based on site conditions.
Threshold Strategy: Yellow warning at 70-80% pipe diameter; Red warning at ≥90%. Road ponding thresholds: 15cm (advisory), 30cm (closure), 50cm (emergency). Avoid one-size-fits-all settings to prevent false alarms.
2. Site Investigation and Equipment Selection
A site investigation must be completed before installation. Key items include pipe diameter, burial depth, invert elevation, chamber dimensions, sludge thickness, toxic gases, power supply, and signal strength. For confined spaces, gas detection is mandatory (Oxygen: 19.5%-23.5%; H₂S below safety limit) with proper ventilation and rescue measures.
Sensor Selection by Condition
Pressure-type: Manholes/pipes; requires air vent tube + desiccant.
Radar: Obstructions/steam/fouling; dead zone 0.3-0.5m.
Ultrasonic: Cost-effective but sensitive to temp/fog.
Flow Meters: Full-pipe (Doppler/EM); Partially-full (Ultrasonic open-channel + weirs/flumes).
Power & Communication
Power: Mains+UPS (urban); Solar (10-30W panel) + Li-Battery (12V/24V) for 3-7 days autonomy.
Comm: 4G Cat1, NB-IoT, 5G, or Fiber. Use edge-trigger mechanisms for high-frequency events to save bandwidth.
3. Level Sensor Installation Procedures

Before installation, clean sludge from the chamber and pipe bottom. Ensure the sensor location won't be covered by sludge long-term.
Pressure-Type Sensors
- Fix to manhole/pipe-bottom bracket.
- Place horizontally; route air vent tube upward/wall-side to prevent water ingress.
- Zero-point calibration: Record empty/low-water condition; set upper range (e.g., 0-5m) in platform.
Radar/Ultrasonic Sensors
- Probe points vertically downward.
- Avoid obstructions (ladders, cables) within 0.3-0.5m below probe.
- Add protective cover/waveguide tube if wind/steam/debris present (tube ID = 2-3x probe diameter).
Data Conversion: Absolute Water Level = Pipe Invert Elevation + Level Value. Relative levels alone cannot link with maps/models for true fullness assessment. Maintain a site ledger with device ID, elevations, and photos.
4. Flow Meter Installation Key Points
Stable flow in the measurement section is critical.
| Type | Straight Pipe Requirements | Installation Notes |
|---|---|---|
| In-Pipe Doppler | Upstream: ≥10D Downstream: ≥5D (Min: 5D/2D with calibration) |
Install at off-center bottom; avoid sediment zones; ensure sufficient depth. |
| Open Channel (Ultrasonic) | N/A (Weir/Flume) | Confirm bed slope/levelness. Zero level at weir crest/flume bottom. Recalibrate if curve distorts. |
| Full-Pipe EM | Standard requirements | Pipe must be full (no bubbles). Electrodes near horizontal axis. Grounding < 10Ω. |
5. Power, Communication & Platform Integration
Acquisition Intervals
- Level: 5 min
- Flow: 1-5 min
- Emergency: 30s-1 min
- Heartbeat: 30m-2h
Solar Setup
- Face Due South
- Tilt: 15°-30° (by latitude)
- Avoid shadows
- Ventilated battery box
Platform Data
- Device ID & Time
- Level & Flow
- Voltage & Signal
- Unified Timestamp
Ensure protection circuits (lightning, reverse polarity, over/undervoltage) are active. For mains power, use UPS to maintain operation for 2-4 hours during outages. Integrate rainfall and pump status for joint analysis in waterlogging scenarios.
6. Commissioning Methods
- Static Calibration: Under no-rain/low-flow, record zero point, range limits, and empty/full values. Pressure sensors: error ≤±1-3% FS. Flow meters: compare with portable current meters at 3+ water level points.
- Dynamic Verification: Observe response to rainfall/pump events. Trunk level should respond within 30-120 mins of 30-50mm rain. Peak lag is expected. Constant level = blockage; Jumps = power/mount issues.
- Threshold Setting: Based on pipe size, burial, and history. Example DN800: Yellow @2.5m, Red @3.2m. Include low-flow (clogging), high-flow (overflow), and negative-flow (backflow) alarms. Review quarterly.
7. Routine Maintenance & Data Governance
Inspection Cycles
Sensor Care: Prevent blockage/drift. Blow air through vent tubes; replace desiccants. Clean radar/ultrasonic probes gently. Insulate in cold regions. For flow meters, remove biofilm/oil/bubbles; check EM liners/electrodes; clear weir debris.
Data Quality: Identify anomalies like static levels during rain (sensor fail) or inconsistent flow/level (sediment/param error). Generate a "data confidence score" for O&M prioritization rather than just counting alarms.
8. Common Fault Troubleshooting
Fault Type 1: No Data
Fault Type 2: Level Too High/Low
Low: Probe bubbles, vent leak, wrong range, elevation conversion error.
Action: Verify platform settings vs. field manual rod measurement.
Fault Type 3: Negative/Jumping/Zero Flow
Jumping: Power fluctuation, poor grounding, vibration, bubbles.
Zero: Sludge cover, low water, sediment, packet loss.
Action: Check Doppler signal/suspended solids or EM empty-pipe alarm/grounding.
Fault Type 4: Intermittent Comm Loss
Remedies: Adjust antenna, use high-gain/ext enclosure, optimize heartbeat, upgrade firmware. Recommend dual links (4G + NB-IoT/BeiDou) for critical areas.
9. Case Studies & Operational Recommendations
Urban Renovation Project
120 points (Level/Flow/Rain/Video) in old city area.
- Identified 3 misconnections, 2 bottlenecks, 1 clog.
- Reduced warning time from 40 mins to 12 mins.
- Optimized pump strategies via correlation analysis.
Industrial Park Outfall
15 sets of Doppler/Pressure sensors.
- Error reduced from ±8% to ±3.5% after recalibration.
- Detected rain-sewage cross-connection via night low-flow anomalies.
- Prevented wastewater entering stormwater system.
Future Outlook & Best Practices
Move from single-point sensing to digital twins. Enhance edge computing for rapid local recognition. Strengthen analysis for inflow/infiltration diagnosis. Establish closed-loop work orders.
Acceptance Criteria: Online rate ≥98%, Completeness ≥95%, Response <4h, On-site <24h. Link all assets in GIS ("Device-Point-Network-Pump-Zone") for effective tracing.

