Urban Pipeline Network Market Trends: 2026 Drainage Pipeline Monitoring Price Trends and Selection Recommendations
As urban drainage and flood-prevention pressure rises, drainage network monitoring is shifting from “installing sensors” to “building a sensing system”. Data such as level, flow, manhole cover status, ponding depth, and sedimentation have become important basis for early warning, dispatching, and maintenance. Industry projects typically determine total investment by the number of monitoring points, communication method, platform capability, and maintenance cost; simply comparing equipment unit prices is no longer sufficient to support procurement decisions.
1. Rising Flood-Prevention Requirements: Network Monitoring Moves from “Visible” to “Computable”
In the past, drainage network management relied mainly on inspections, dredging records, and post-rainstorm reviews, so problems were often discovered late. With increasing frequency of extreme rainfall, urban flood-prevention requirements have shifted from “post-event response” to “pre-event warning, in-event dispatching, and post-event assessment”. Drainage network monitoring has therefore entered a refined stage.
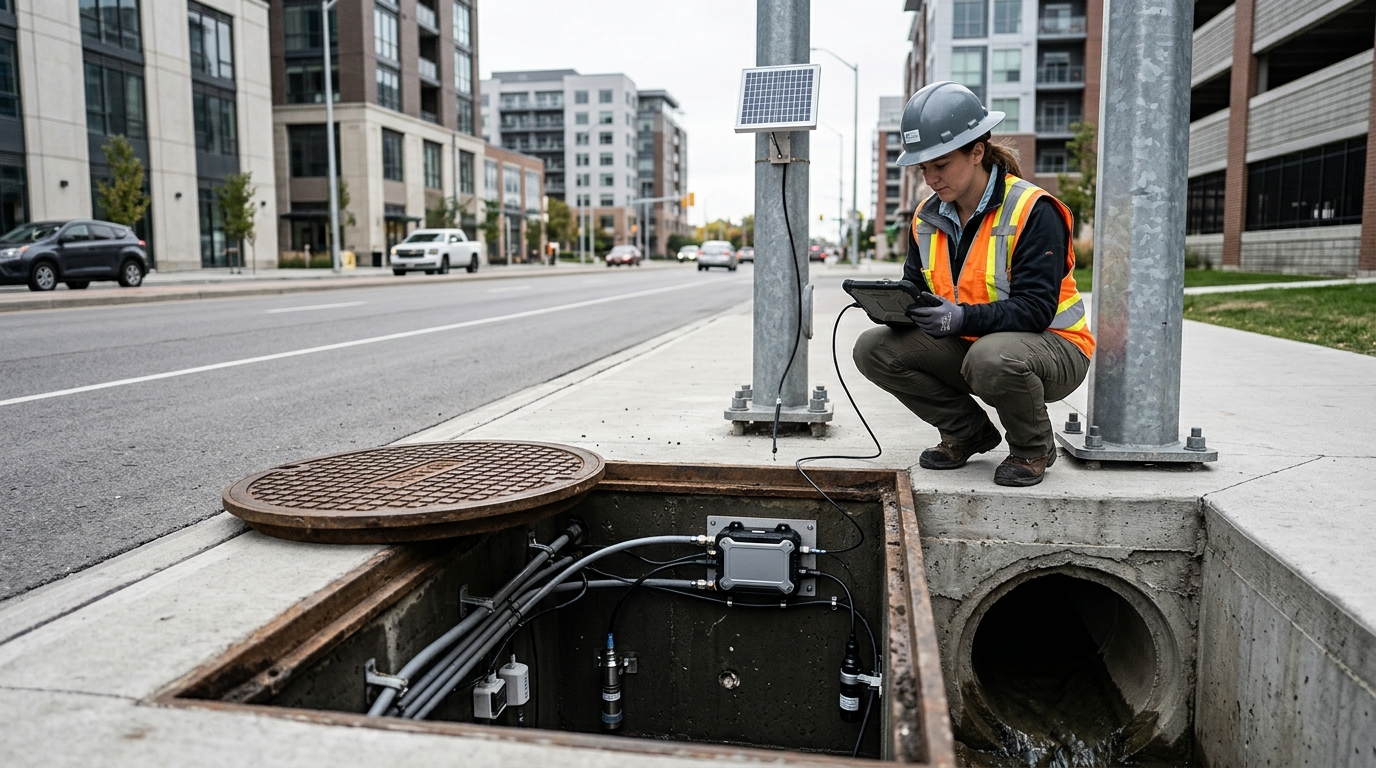
Level monitoring can determine whether pipelines are approaching full flow and whether inspection wells are surcharging; flow monitoring can identify network conveyance capacity, abnormal external inflow, and illicit discharge or misconnections; ponding depth and manhole cover status monitoring directly serve road safety and emergency response. A common industry configuration is 20 to 60 basic monitoring points per square kilometer, with denser deployment in low-lying areas, pump station forebays, inlet/outlet of retention/storage facilities, and surcharge-prone wells.
A medium-sized urban drainage monitoring project typically includes 100 to 500 sensing points, with communication mainly via NB-IoT, 4G, and LoRa, sampling intervals ranging from 1 to 10 minutes, and flood-prevention scenarios often reporting every 2 to 5 minutes. If monitoring data is used only for viewing, its value is limited. Only when level, flow, rainfall, and pump station status are brought into the same platform can correlated analysis of water level—flow—load—risk be formed to support threshold-based warning and dispatch recommendations.
2. Monitoring Product Price Ranges: Clearly Stratified Devices
The price range of drainage network monitoring equipment is wide, mainly depending on measurement principle, accuracy, protection rating, communication capability, and installation complexity.
Level Devices
- Pressure-type: CNY 200–800/unit. Suitable for continuous measurement inside wells (0–5m/10m ranges).
- Ultrasonic: CNY 300–1,500/unit. Installed at well opening; affected by steam/debris.
- Radar: CNY 800–3,000/unit. Higher stability for complex conditions.
Flow Devices
- Open-channel: CNY 1,500–5,000/set. Requires flumes/weirs.
- Electromagnetic: CNY 3,000–15,000/unit. For full-pipe/high-solids content.
- Partially filled pipe: CNY 4,000–12,000/set. Derives flow from models; sensitive to sedimentation.
Flood-prevention sensing devices (ponding, manhole tilt, sedimentation) cost about CNY 300 to 2,000 per point. Integrated drainage monitoring terminals, which combine level, flow, communication, power, and lightning protection, cost CNY 5,000 to 30,000 per set. Overall, basic level points have lower costs, while flow points and comprehensive monitoring points have significantly higher costs.
3. Total Project Cost: Beyond Equipment
Costs consist of five parts: equipment, construction, communication, platform, and O&M. Equipment procurement often accounts for only 40% to 60% of total investment. Construction costs vary widely: single monitoring point construction ranges from CNY 1,000 to 8,000, but may reach CNY 10,000 to 30,000 if road breaking, brackets, solar panels, or pipeline retrofitting are involved.
Platform costs vary significantly: lightweight platforms (CNY 100k–300k), GIS/Alarm platforms (CNY 300k–1M), and Hydraulic Modeling systems (CNY 1M–3M).
For a 300-point project, total investment ranges from CNY 1.5M–3M (level only) to CNY 3M–6M (with flow points), and up to CNY 5M–9M with model platforms. Purchasers should use “cost per completed point” and “annual operating cost per point” as core indicators.
4. Selection Recommendations: Scenario-Based Technical Routes
Clarify the monitoring purpose first. Do not choose sensor types arbitrarily.
- Flood-Prevention Warning: Focus on level, rainfall, and pump status. Use Radar or Pressure transmitters. Alarm thresholds: >70-80% pipe diameter, or ponding >15-30cm.
- Network Load Assessment: Requires flow data. Use Electromagnetic meters for full pipes; Partially filled/Open-channel meters for others (requires calibration).
- Operation & Maintenance: Add sedimentation, manhole status, and blockage warnings.
Consider protection ratings (IP68 for in-well), power supply (battery 3-5 years vs. solar), and communication (NB-IoT for dispersed, 4G for high bandwidth, LoRa for self-built networks). A 3- to 6-month pilot is recommended before large-scale deployment to verify drift, success rate, and false-alarm rates.
5. Maintenance Cost Analysis: Full-Lifecycle Investment
Annual maintenance costs typically amount to 8% to 15% of initial construction costs, potentially rising to 15% to 25% for complex environments.
Sensor Maintenance
Pressure: Diaphragm cleaning (CNY 50–200/visit).
Flow Meters: Higher costs. Open-channel (CNY 1k–5k/year); Electromagnetic requires electrode calibration.
Infrastructure & Data
Batteries/Antennas: Replacement CNY 50–300; Repair CNY 200–1,000.
Data Services: Outlier removal, threshold adjustment, and report generation incur ongoing labor costs.
For a 300-point project, annual maintenance budgets typically need CNY 200,000 to 600,000. Adding hydraulic models requires an additional CNY 50,000 to 200,000 per year for parameter calibration.
6. Case Comparison: Urban, Industrial Park, and Aging Networks
Eastern Urban District (Flood Prevention)
Config: ~300 points (Radar level + Ponding), 30 flow points.
Cost: Invest CNY 3.5M–5M; Maint. CNY 300k–500k/year.
Result: Response time shortened by 10–25 mins; False alarms reduced to 8–12%.
Southern Industrial Park (Load & Discharge)
Config: ~80 points (High flow proportion 35-45%).
Cost: Invest CNY 0.8M–1.5M; Maint. CNY 30k–80k/year.
Challenge: Complex well conditions (oil/sludge) increased calibration needs.
Aging Network Retrofit (Low Budget)
Config: 100 points (Pressure level + LoRa).
Cost: Invest CNY 0.5M–1M.
Issue: High fouling led to maintenance ratio of 18–25%. Prioritize easy-maintenance solutions here.
7. Outlook: Model Linkage and Resilient Dispatch
Future competitive focus shifts from hardware unit price to data quality and closed-loop business capability. Key trends include:
- Sensing-Model Linkage: Joint input of level, flow, tide, and gate status into hydraulic models for risk grading.
- Risk-Graded Management: Deployment based on risk level rather than just location; edge computing for high-risk zones.
- Resilient Dispatch: Balancing flood safety, sewage interception, ecology, and energy consumption.
Mature systems should achieve a data completeness rate above 95%, alarm response time <5 minutes, and false-alarm rate <10%. Bidding indicators should include these performance metrics alongside annual maintenance costs.

