How a Water Utility Group Achieves Cost Reduction and Efficiency Enhancement through the Digitalization of Irrigation Districts
Transforming traditional irrigation from "experience-based" to "data-driven" in a large-scale Yellow River diversion project.
I. Introduction: The Shift from Experience to Data
In a massive Yellow River diversion irrigation district on the North China Plain, a transformative informatization renovation is reshaping water management across 865,000 mu of cultivated land. Spanning 12 townships and 217 administrative villages, this project—launched in October 2023 and fully accepted by April 2025—has successfully established an operation system centered on smart irrigation and supported by a comprehensive digital platform.
Infrastructure Upgrades
- 217 new/renovated water measurement stations
- 156 sluice gates upgraded for remote control
- 84 soil moisture & 12 weather stations deployed
- Over 19,000 measurement points integrated
Key Performance Indicators
- Water Efficiency: Coefficient increased from 0.482 to 0.556
- Consumption: Reduced from 285m³/mu to 226m³/mu
- Savings: ~42 million cubic meters annually
- Precision: Distribution error narrowed to ±5%
This case demonstrates that irrigation district informatization is not merely about installing sensors or building monitoring screens. It is about promoting the transition of water resource scheduling from empirical judgment to data-driven decision-making, achieved through the synergy of water measurement, automatic control, model computation, and business management systems.
II. Project Background: Addressing Critical Pressures
Originally built in the 1960s, this large-scale district relies on Yellow River water supplemented by groundwater. With a designed irrigation area of 865,000 mu and a complex network of over 1,200 kilometers of canals, it faces significant challenges including grain production, facility agriculture, and rural domestic water supply.
Before the renovation, the effective utilization coefficient of irrigation water was only 0.482, significantly lower than the average level of advanced irrigation districts in surrounding areas.
Pre-Renovation Challenges
- Aging Infrastructure: Silted canals and collapsed slopes resulted in a water conveyance loss rate of approximately 22%.
- Inadequate Measurement: Only 37% of main canals had stable measurement conditions; below the branch canal level, reliance was mostly on manual observation.
- Empirical Scheduling: Reliance on telephone communication led to frequent disputes between upstream and downstream users during droughts.
- Inefficient Billing: Water fees were apportioned by acreage rather than actual consumption, providing insufficient incentive for saving water.
To address these issues against the backdrop of rigid water resource constraints, the project objectives focused on increasing water measurement coverage, achieving remote control of key gates, constructing water demand prediction models, and promoting volumetric water fee collection.
III. Technical Challenges: A Fourfold Hurdle
The project faced distinct technical barriers related to measurement accuracy, connectivity, hydraulic dynamics, and operational synergy.
Measurement Accuracy in Sediment-Laden Water
Sediment concentrations ranging from 2 kg/m³ to 18 kg/m³, along with aquatic weeds and irregular cross-sections, made traditional flow meters inaccurate. Manual measurements took 40 minutes per instance with unstable data.
Power and Communication Gaps
Scattered structures lacked fiber optics and grid power. Solutions required low-power wireless transmission (LoRa), lightning protection, and battery redundancy for at least 15 days of continuous rain.
Hydraulic Lag and Multi-Objective Scheduling
Water transport takes 6–18 hours. Adjusting gates manually often caused upstream overflow or downstream shortages. Schedulers had to balance conveyance capacity, water rights, and crop-specific demands simultaneously.
System Silos and Grassroots Adoption
Legacy systems for video, billing, and inspections were fragmented. Complex interfaces risked overwhelming older staff, necessitating simplified, unified platforms and standardized O&M processes.
IV. Solutions: Integrated "Perception-Network-Platform-Control"
To overcome these challenges, the project adopted a four-layer integrated architecture:
Perception Layer
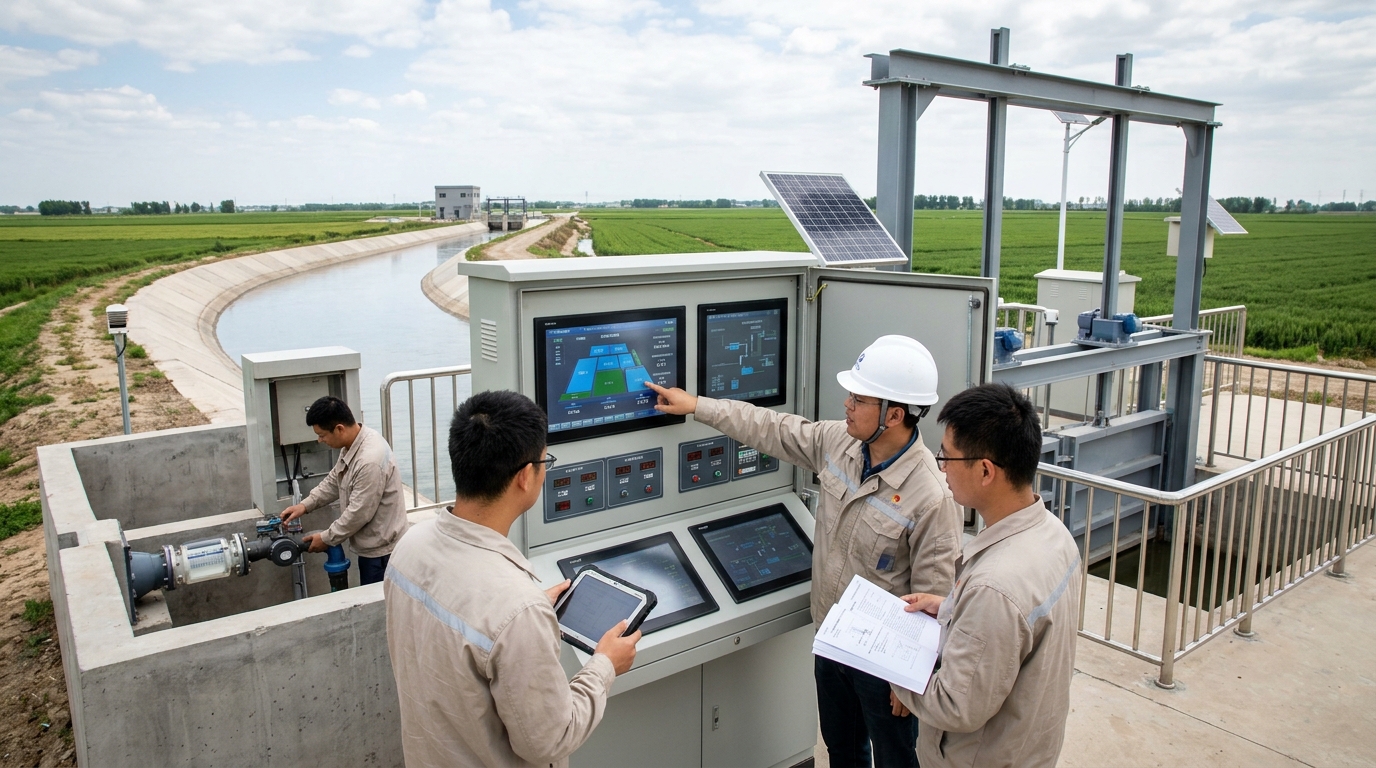
Deployed 217 water measurement stations, 156 gate monitors, 84 soil moisture stations, and 12 weather stations. This creates a comprehensive network covering water level, flow, velocity, and environmental data across main and branch canals.
Network Layer
Utilized a hybrid "Fiber Optics + Wireless" mode. 58km of optical cable was laid for critical nodes, while LoRa wireless networks covered remote areas. Field RTUs consume less than 8W, powered by solar and lithium batteries.
Platform Layer
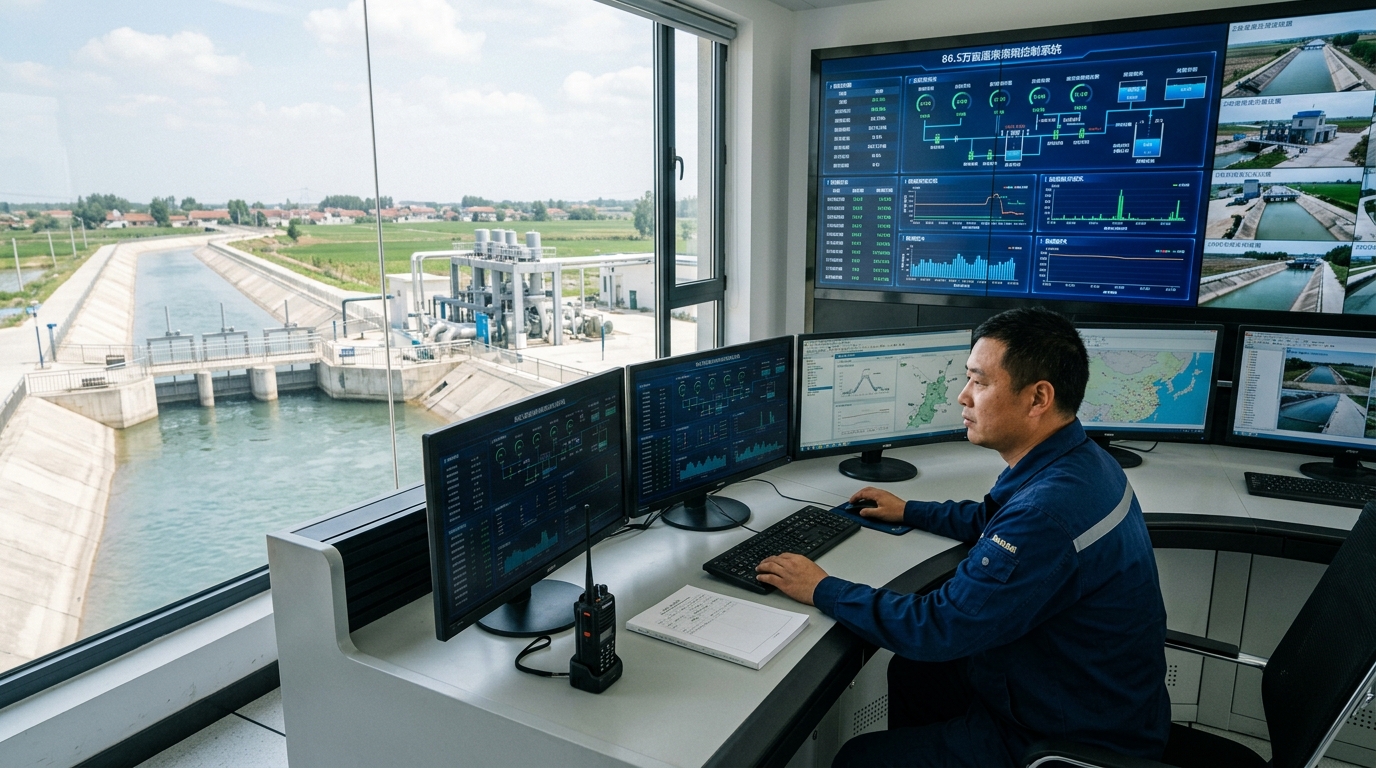
A unified management platform featuring SCADA, GIS mapping, smart water distribution, and mobile apps. It standardizes over 19,000 measurement points into a "one-file-per-gate/canal" structure.
Control Layer
Automated 156 gates with electric/hydraulic drives. The system enables remote control, local manual override, emergency power-off, and limit protection, issuing commands based on automated scheduling plans.
V. Smart Irrigation: Key Technologies and Models
The core of the system lies in precise measurement and predictive modeling.
Precision Water Measurement
- Main Canals: Radar water level gauges combined with velocity-area methods achieve an error margin of ±2.5%.
- Branch Canals: Ultrasonic transit-time flow meters and Parshall flumes maintain an overall error of ±4%.
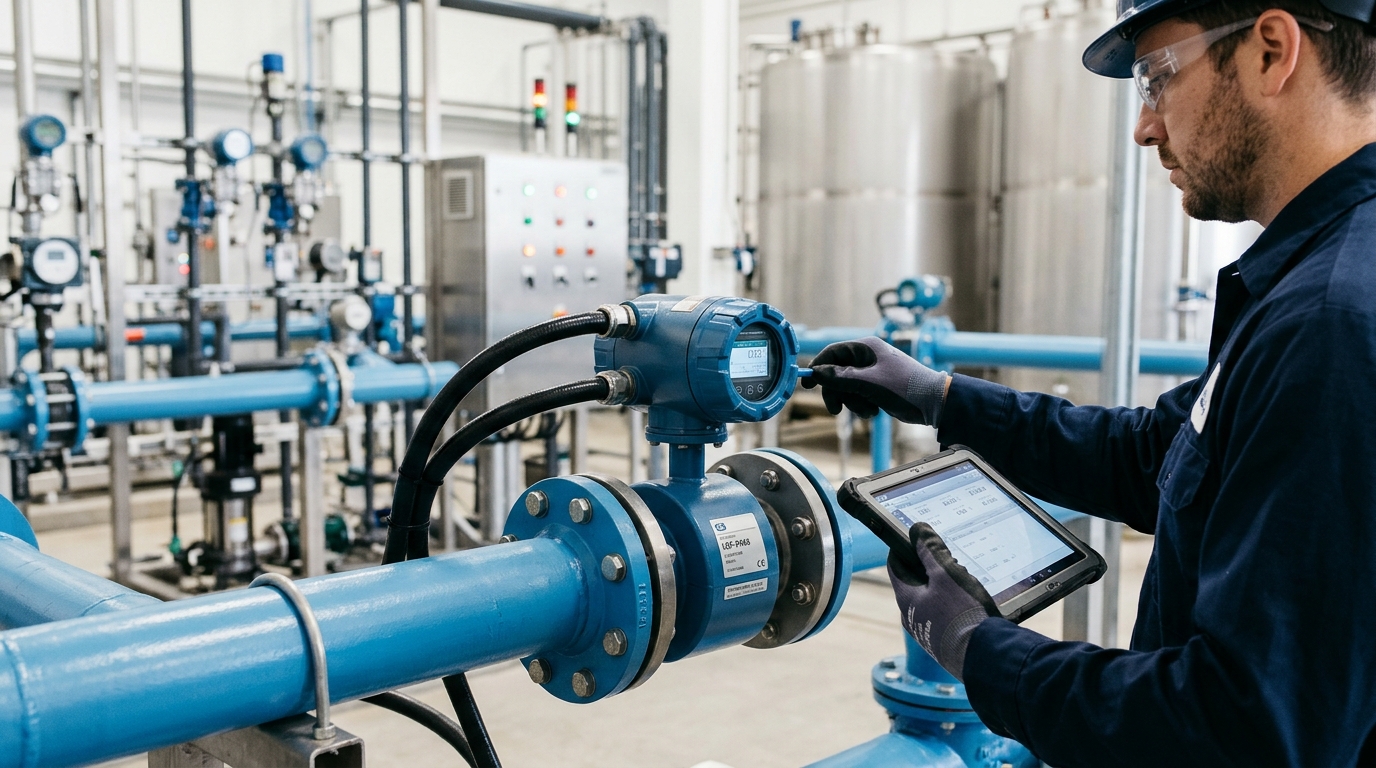
- Pipelines: Electromagnetic flow meters provide ±0.5% accuracy for pressurized irrigation areas.
Smart Scheduling Models
The platform integrates soil moisture data (at depths of 10cm, 20cm, 40cm, 60cm) and meteorological data to calculate crop water demand using the Penman-Monteith evapotranspiration model. This allows for 7-day irrigation demand predictions with an error rate within 8%.
Using Model Predictive Control (MPC), the system performs rolling calculations for gate openings and water levels. It generates adjustment recommendations for the next 24–72 hours, reducing plan compilation time from 2 days to just 2 hours and rotational irrigation planning time from 4 hours to 20 minutes.
VI. Implementation: Phased Construction and Commissioning
The 18-month implementation cycle was divided into four rigorous stages:
- Preliminary Survey (Mar–Sep 2023): Completed feasibility studies and surveyed 128.6km of main canals, identifying 1,260 measurement cross-sections.
- Phase I Construction (Oct 2023–Apr 2024): Focused on main canals, completing 38 measurement points and upgrading 56 backbone gates.
- Phase II Construction (May–Oct 2024): Extended to branch canals, adding 92 measurement points and 84 soil moisture stations.
- Phase III & Acceptance (Nov 2024–Mar 2025): Finalized platform functions, conducted full-system joint commissioning, and trained 260 personnel.
During commissioning, 286 defects were resolved, including sensor calibration and communication blind spot supplementation. Final acceptance showed a remote control success rate of 99.2% and a data reporting rate of 99.6%.
VII. Operational Results: Efficiency and Sustainability
After two complete irrigation seasons, the project has delivered tangible economic and environmental benefits.
Key Metrics Improvement
Management efficiency has skyrocketed, with automatic metering reaching 92% and manual workload reduced by 80%. The transition to volumetric billing has improved user compliance and reduced grievances. Environmentally, the precision of surface water delivery allowed villages to reduce backup well usage, lowering groundwater extraction by approximately 9 million cubic meters.
VIII. Conclusion and Outlook
This irrigation district's journey illustrates that smart irrigation is not a one-time installation but a continuous management process. By moving from "post-event scheduling" to "pre-event simulation" via digital twins, the district is setting a new standard for modern water resource management.
The project provides a replicable path for other large-scale districts: base informatization on accurate water measurement, center it on smart irrigation algorithms, and guarantee it with unified platforms and standardized operations. As sensor costs decrease and data models mature, such digital transformation will become essential infrastructure for agricultural modernization and sustainable water resource allocation.