How a Water Utility Group Achieves Cost Reduction and Efficiency Gains through Digitalization of Irrigation Districts
Ecolor Technology recently compiled a case study from the perspective of irrigation district informatization and agricultural water-saving practices on an informatization project for a large Yellow River diversion irrigation district in the lower reaches of the Yellow River in a certain province. The irrigation district has a design irrigation area of 320,000 mu, covering 4 townships and 18 administrative villages, with main canals totaling 126 km in length and branch and lateral canals totaling 384 km.
Project Overview & Key Metrics (2024 Verification):
- Scope: Connected 28 canal-head/main-canal nodes, 64 branch-canal nodes, and 210 lateral-outlet metering points.
- Sensors: Deployed 36 soil moisture stations, 12 mini weather stations, and 48 video surveillance checkpoints.
- Efficiency: Effective utilization coefficient increased from 0.52 to 0.61.
- Water Saving: Consumption per mu decreased from 280 m³ to 210 m³.
- Coverage: Metering coverage above lateral outlets reached 100%.
1. Project Background: Irrigation District Management Transformation Under Water Resource Constraints
The irrigation district is located on the alluvial plain of the lower Yellow River and is an important grain production base in the region, with winter wheat and summer corn as the main crops. The annual divertible Yellow River water volume is about 120 million m³, and agricultural water use accounts for more than 80% of total regional water use. With the advancement of groundwater over-extraction governance, total water use control, and comprehensive agricultural water pricing reform, the extensive water allocation methods long relied upon by the district came under pressure. Before renovation, annual agricultural irrigation water use in the district was about 90 million m³, water consumption per mu was about 280 m³, and some canal sections still required queueing for gate-opening requests during spring and summer irrigation peaks; both water use efficiency and water use equity had room for improvement.
Before project initiation, the management office organized two rounds of baseline surveys. The surveys covered 18 administrative villages, 32 water user groups, and 210 major lateral outlets, and 1,260 valid questionnaires were collected. The results showed that about 63% of farmers still preferred time-based irrigation rather than crop-water-demand-based irrigation, about 57% of water users reported that water allocation information was not transparent, and about 41% of disputes were related to inaccurate gate water volumes and untimely gate-opening requests. The management office originally had 18 manual canal patrol staff. During the flood season and irrigation peaks, average daily patrol time was about 6 hours, but the work mainly relied on visual water level observation, tape-measure measurements, and verbal gate-opening requests, making it difficult to form stable data assets. Based on this, the project proposed the construction objectives of "measurement to lateral outlets, control to gates, services to farmers, and data to platform".
2. Construction Foundation: The Starting Point from Manual Canal Patrol to Data Sensing
Before implementation, the canal system lining rate in the irrigation district was about 72%. Main canals and important branch canals had certain control capability, but final-level canal systems below lateral outlets commonly suffered from leakage, sedimentation, and cross-section deformation. The canal system water utilization coefficient was about 0.58, the field water utilization coefficient was about 0.80, and the effective utilization coefficient of irrigation water was about 0.52. Traditional water measurement relied mainly on manual water level observation and empirical estimation; data records were incomplete, and there was no closed-loop verification between water fee collection and water use statistics. Although the management office had built a small number of video surveillance and gate opening monitoring points, the systems were scattered and protocols were not unified, making it difficult to support water allocation scheduling and operation and maintenance.
Investment Breakdown
Total Investment: ~CNY 76 Million
- Water Measurement & IT Equipment: ~CNY 53 Million
- Civil Works & Ancillary Renovation: ~CNY 23 Million
Construction Scope
- Diversion intake at canal head
- 28 main-canal control cross-sections
- 64 branch-canal diversion outlets
- 210 lateral-outlet metering points
- Data center & Scheduling Platform
The project was not merely equipment installation, but integrated water measurement, gate control, water rights allocation, irrigation services, O&M management, and water fee collection into a single engineering system, providing basic conditions for subsequent smart irrigation scheduling.
3. Technical Challenges: Open-Channel Measurement, Communication and Power Supply, and Model Adaptation
The first core difficulty of irrigation district informatization came from water measurement. Yellow River water has high sediment concentration, and canal cross-sections are prone to sedimentation after the flood season. Aquatic vegetation, wind waves, and changes in roughness all affect the stage-discharge relationship. The project team calibrated 32 major canal sections and collected nearly 18,000 sample points. Initial tests showed that for some trapezoidal open channels, flow error could exceed 12% at low water levels, and the error was further amplified when aquatic vegetation covered the channel. To address this, the project adopted combined observation using radar water level gauges, ultrasonic water level gauges, gate opening sensors, and cross-section video, established dynamic calibration curves for key canal sections, and incorporated cross-section deformation, roughness corrections, and dredging records into the platform data model.
"Communication and power supply were also important constraints... Fiber optics covered 82% of nodes, 4G/5G covered 15%, and remote nodes used BeiDou short messages for data backhaul."
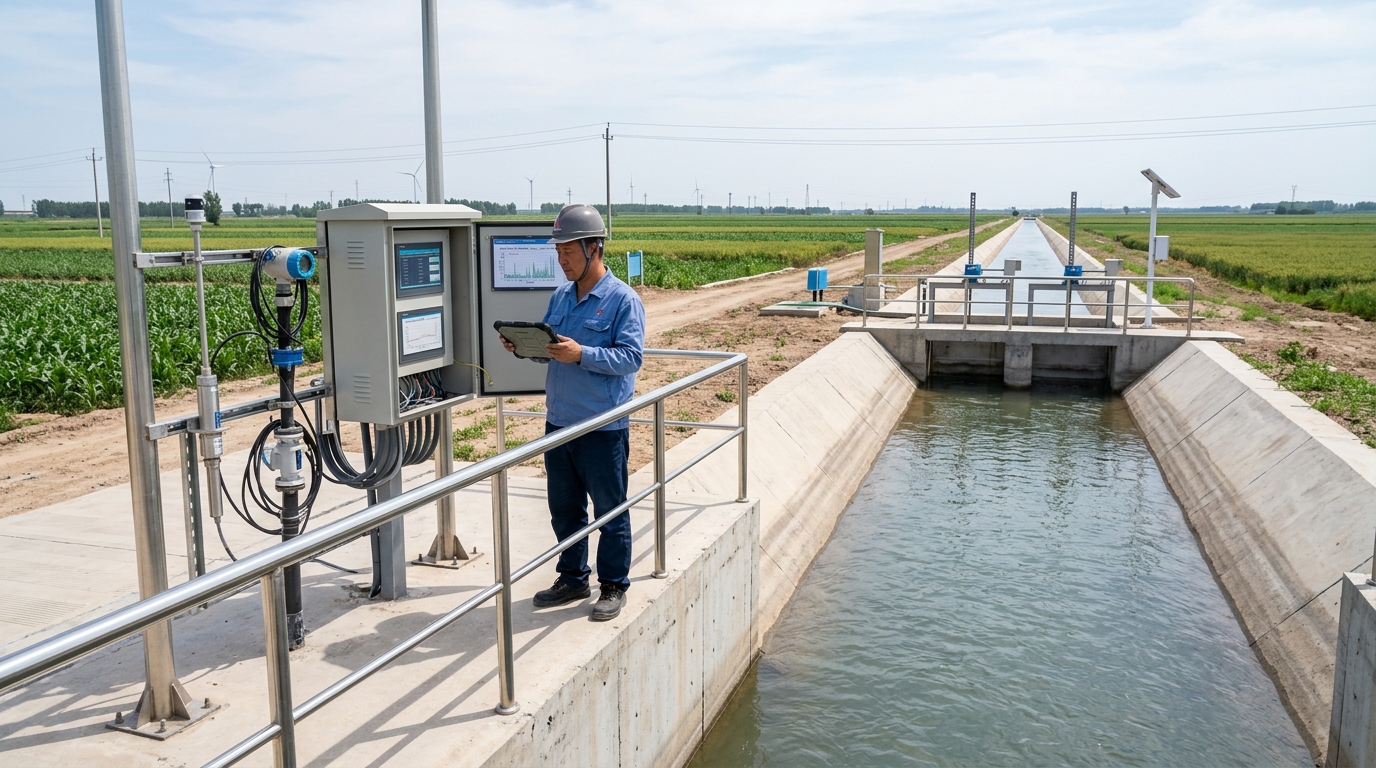
Irrigation district nodes were dispersed, and some lateral outlets were located deep within farmland, where grid power access was difficult and fiber-optic coverage cost was relatively high. The project ultimately formed a communication scheme of "fiber optics as primary, wireless as secondary, and satellite short messages as supplement". 37 solar-powered nodes were equipped with 120 Ah batteries and edge storage gateways, capable of locally storing 7 days of data during communication interruptions and automatically resuming transmission after recovery. The target for device online rate was set at over 95%, and the actual rate during trial operation reached 98.6%.
Localized adaptation of smart irrigation models was also challenging. Wheat and corn respond differently to soil moisture at different growth stages, and directly applying generic crop water requirement models would cause irrigation threshold deviations. By combining weather stations, soil moisture stations, and field experiments in the irrigation district, the project team established a wheat-corn rotation irrigation regime. Soil moisture stations monitored depths of 20 cm, 40 cm, and 60 cm. During the wheat green-up stage, suitable soil moisture content was controlled at 18% to 22%; during the stem elongation stage, it was increased to 20% to 24%; during the corn stem elongation stage, suitable moisture content was controlled at 20% to 24%. Through ET0 evapotranspiration calculation, soil moisture feedback, and gate opening linkage, the platform generated irrigation recommendations for different rotational irrigation groups.
4. Solution: Sensing, Platform, and Scheduling Closed Loop
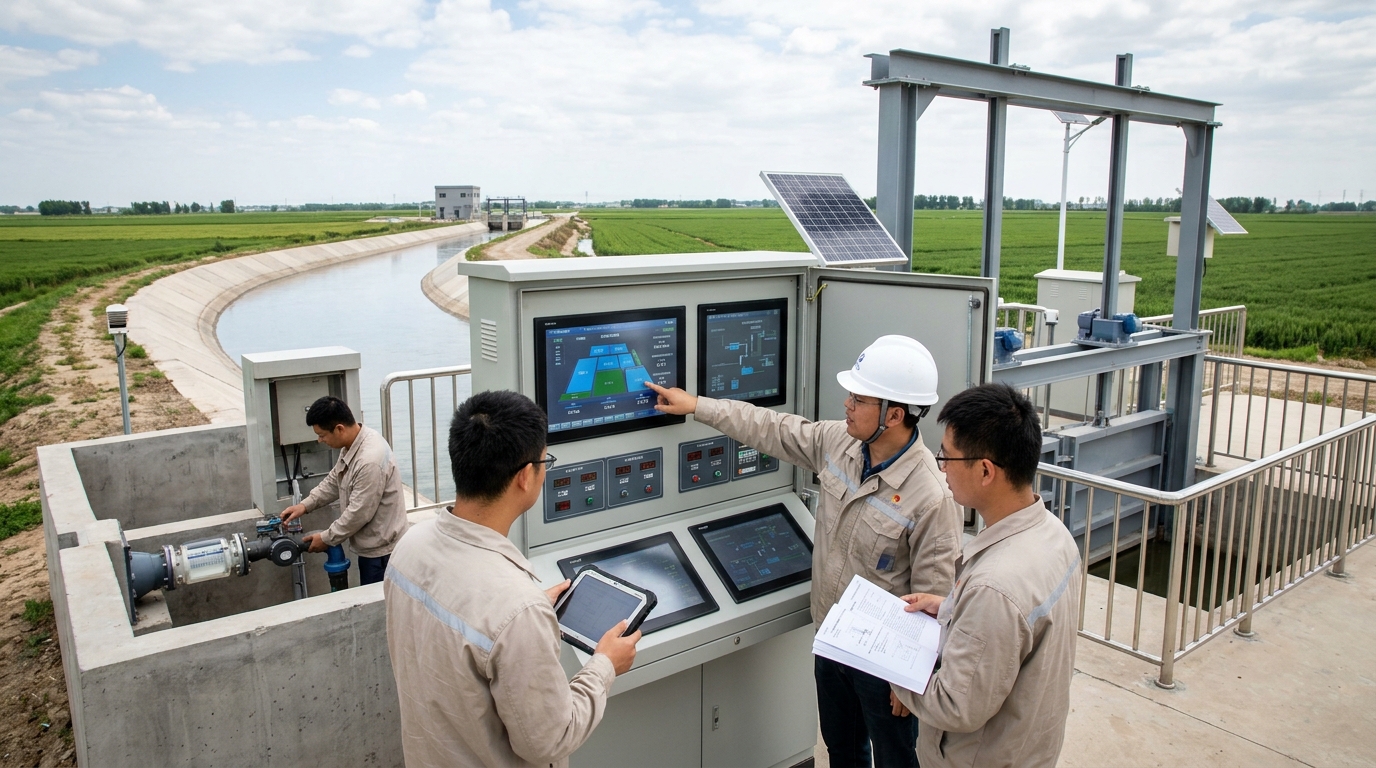
The project formed a four-layer architecture: sensing layer, transmission layer, platform layer, and application layer. The sensing layer included canal-head flow meters, water level and flow monitoring devices for main and branch canals, gate opening sensors, electric gates at lateral outlets, rectangular weirs and Parshall flumes, soil moisture stations, mini weather stations, video surveillance, and water fee metering modules. The application layer included modules for water allocation planning, gate control, water measurement statistics, irrigation services, O&M alarms, water rights management, and water fee collection. Built on a GIS one-map base, the platform associated canals, hydraulic structures, water users, water rights, and real-time data, enabling process visualization from the canal head to lateral outlets.
Tiered Metering Strategy & Accuracy Targets
- • Canal Head/Main Canals: Prioritized accuracy using Doppler flow monitoring or calibrated stage-discharge relationships. Target Error: < 5%
- • Branch Canals: Used radar water level gauges in combination with electric gate control. Target Error: < 8%
- • Lateral Outlets: Mainly used Parshall flumes, rectangular weirs, and ultrasonic water level gauges to balance convenience and cost. Target Error: < 10%
In smart irrigation, the platform linked water allocation plans, gate openings, and field soil moisture data. After the management office issued a water allocation plan, the system generated rotational irrigation commands based on canal conveyance time, gate openings, and target flow at lateral outlets. After field electric gates received commands, gate opening feedback error was controlled within 5%; average remote command response time was within 15 seconds, and average local control response time was within 30 seconds. The platform could perform rolling corrections based on upstream inflow, canal water levels, soil moisture, and weather forecasts. In cases such as device offline, abnormal flow, gate jamming, or water level exceeding limits, the system pushed alarms to O&M personnel and managers within one minute.
5. Implementation Process: Survey, Calibration, Joint Commissioning, and Training
The project completed feasibility study and preliminary design in October 2022 and officially started construction in March 2023. The first phase was on-site survey and equipment selection. The team conducted cross-section measurements for 510 sections at main canals, branch canals, and lateral outlets, screened nodes suitable for installing metering facilities, and completed assessment of equipment protection, power supply, and communication conditions. The second phase was civil works and equipment installation, focusing on the canal-head control section, lateral-outlet metering flumes, gate foundations, solar mounting brackets, and fiber-optic laying. The third phase was system joint commissioning, including device access, protocol parsing, data validation, platform deployment, and application module configuration.
From September to October 2023, the project entered trial operation. During trial operation, the management office conducted 72-hour continuous stress tests on 28 main-canal nodes and 64 branch-canal nodes. Data completeness rate reached 99.4%, video access success rate reached 99.1%, and remote gate control success rate reached 98.7%. During spring irrigation from March to May 2024, the system completed the first round of water allocation closed-loop verification, involving 12 rotational irrigation groups, 86 lateral outlets, and about 116,000 mu of irrigation area. In June 2024, the project passed acceptance inspection. The inspection team focused on metering accuracy, platform stability, data security, and the use of farmer services.
Training and promotion were key aspects of implementation. The project organized a total of 32 training sessions for management office staff, township water management station staff, water user association representatives, and farmers, with 1,260 person-times of participation. On the farmer side, users mainly queried gate-opening request status, irrigation progress, and water use details through WeChat mini-programs and village bulletin screens. After the system went live, the average time for farmers to submit gate-opening requests was reduced from about 3 days to within 2 hours. Water allocation notices from the management office changed from manual telephone calls and paper slips to platform push notifications, reducing repeated communication costs.
6. Final Results: Water Saving, Efficiency Improvement, and Better Water Use Management
25%
Water Saving Rate
17.8%
O&M Cost Reduction
38%
Dispute Decrease
Based on the 2024 summer irrigation verification data, the first major change brought by the project was improved water use efficiency. Agricultural irrigation water use in the district decreased from about 90 million m³ before renovation to about 67 million m³, water consumption per mu decreased from 280 m³ to 210 m³, water saved was about 23 million m³, with a water saving rate of about 25%. The effective utilization coefficient of irrigation water increased from 0.52 to 0.61, the canal system water utilization coefficient increased from 0.58 to 0.72, and the field water utilization coefficient remained around 0.85. This change was jointly related to the increase in canal lining rate from 72% to 86% and the closed loop of lateral-outlet metering and gate control.
Management efficiency also improved significantly. Manual canal patrol staff in the management office decreased from 18 to 11, average daily patrol time decreased from about 6 hours to 2.5 hours, and the inspection frequency of key canal sections was adjusted from once daily to a combination of on-demand inspection and video review. System device online rate was 98.6%, data completeness rate was 99.4%, and deviation in execution of water allocation plans was controlled within 5%. The number of water disputes decreased by 38% year-on-year, mainly because lateral-outlet metering, water use details, and gate-opening request records were traceable, reducing water users' disputes over water volume and fees. Annual O&M costs decreased from about CNY 4.2 million to about CNY 3.45 million, a reduction of about 17.8%.
In terms of economic benefits, average irrigation water fees and related water use costs per mu decreased from about CNY 68 to about CNY 52, and farmers' actual water use costs fell by about 23%. Based on an irrigation area of 320,000 mu, annual water use costs decreased by about CNY 5.12 million. At the same time, precision irrigation reduced the risks of field waterlogging, fertilizer loss, and pests and diseases caused by excessive irrigation. In some demonstration plots, average wheat yield per mu remained stable, corn irrigation assurance during the tasseling stage improved, and water and fertilizer use efficiency increased by about 8% to 12%. The management office could also use metering data to conduct water use audits, water rights accounting, and allocation of water-saving incentives.
7. Case Insights: How Water Measurement and Smart Irrigation Form Synergy
This case shows that irrigation district informatization cannot remain at the level of "installing equipment and viewing data"; instead, it should form a closed loop among water measurement, gate control, water allocation planning, and water use services. Water measurement is the foundation; without stable metering above lateral outlets, smart irrigation easily loses its execution basis. Smart scheduling is a means; if data cannot be transformed into water allocation commands and farmer actions, informatization systems will still revert to the reporting level. Through the "measurement-control-feedback-correction" mechanism, the project enabled the management office to dynamically allocate water based on upstream inflow, canal water levels, soil moisture, and farmers' gate-opening requests, reducing waiting and excessive water use caused by fixed rotational irrigation.
Another insight is that water-saving effects come from management coordination rather than a single technology. The irrigation district combined metering data with water pricing reform, water user association management, village-level public disclosure, and farmer inquiries, shifting farmers from "cost sharing by area" to "metered by volume and charged per cubic meter". When water users can see lateral-outlet flow, cumulative water use, and fee details, their willingness to proactively control irrigation duration increases significantly. During the 2024 summer irrigation, the average gate-opening request duration of farmers in the demonstration area was shortened by about 35% compared with before renovation; some wheat maturity-stage plots reduced one irrigation, saving about 18 m³ per mu.
8. Future Outlook: From Informatized Irrigation District to Smart Irrigation District
In the next stage, the irrigation district plans to continue improving around digital twin irrigation districts, water demand forecasting, remote sensing monitoring, and replacement of aging equipment. The management office intends to refine three-dimensional models of main canals and important branch canals between 2025 and 2027, integrate drone canal patrol, satellite remote sensing evapotranspiration estimation, and groundwater level monitoring data, and build more refined crop water demand forecasting capability. The goal is to increase the effective utilization coefficient of irrigation water to 0.65, control water consumption per mu to about 190 m³, extend metering services to final-level canal systems and field plots, and strive for field-plot-level metering coverage of more than 60%.
From industry practice, irrigation district informatization is moving from single-point monitoring to full-process management, and from water volume statistics to coordination of water rights, water pricing, and water services. Ecolor Technology believes that the value of similar projects lies not only in device online rate and data completeness rate, but also in whether water measurement data can be transformed into water allocation decisions, smart irrigation recommendations into farmer actions, and water-saving effects into quantifiable water resource benefits. In the future, with deepening agricultural water pricing reform, improvement of digital twin platforms, and promotion of small irrigation district renovation, the integration of smart irrigation and water measurement will become an important path for water saving and efficiency improvement in large and medium-sized irrigation districts.