Irrigation District Informatization: Selection and Maintenance — How Much Does Smart Irrigation Cost?
Moving from demonstration projects to routine deployment, smart irrigation requires a deep understanding of market stratification, equipment parameters, and long-term operational costs. This guide analyzes price ranges, technical specifications, and maintenance strategies for irrigation district managers and project implementers.
Introduction: From Showcase to Foundation
In recent years, irrigation district informatization is no longer merely a “showcase window” for a few pilot projects; it is becoming a foundational tool for the renovation of large and medium-sized irrigation districts, high-standard farmland construction, water resource management, and the implementation of agricultural water-saving systems. Driven by demands such as water-use metering, gate regulation and control, soil moisture monitoring, water fee collection, and dispatch early warning, keywords such as smart irrigation, water saving, water measurement, and informatization have moved from policy documents into procurement lists, project feasibility studies, equipment selection, and O&M budgets.
For the industry, market focus has shifted from “whether a system exists” to “whether it can operate stably over the long term and deliver quantifiable water-saving benefits and management efficiency gains.”
Based on publicly available project information and construction experience in multiple regions, the irrigation district informatization market exhibits clear stratification: small irrigation districts focus more on basic metering and low-cost deployment, medium-sized irrigation districts emphasize canal-system water measurement, gate control, and platform integration, and large irrigation districts move further toward dispatch models, data governance, secure O&M, and multi-department collaboration. Price ranges, equipment parameters, system architecture, and maintenance costs are becoming key dimensions for procurers to judge project success or failure.
I. Market Structure: The "Measurement—Control—Service" Closed Loop
The core sources of current demand include agricultural water-saving transformation, rigid water resource constraints, continued construction, water price reform, and flood control. In the past, many projects focused mainly on “building a platform and installing a few monitoring points,” whereas today it is more common to require a closed loop: the front end can measure water, the middle layer can transmit and store data, the back end can analyze, warn, and dispatch, and further integrate with management processes such as water-user organization, water fee settlement, and water-saving evaluation.
Small Districts
CNY 300k - 1.2M: Focus on basic monitoring of water level, flow rate, and gate status plus a lightweight platform.
Medium Districts
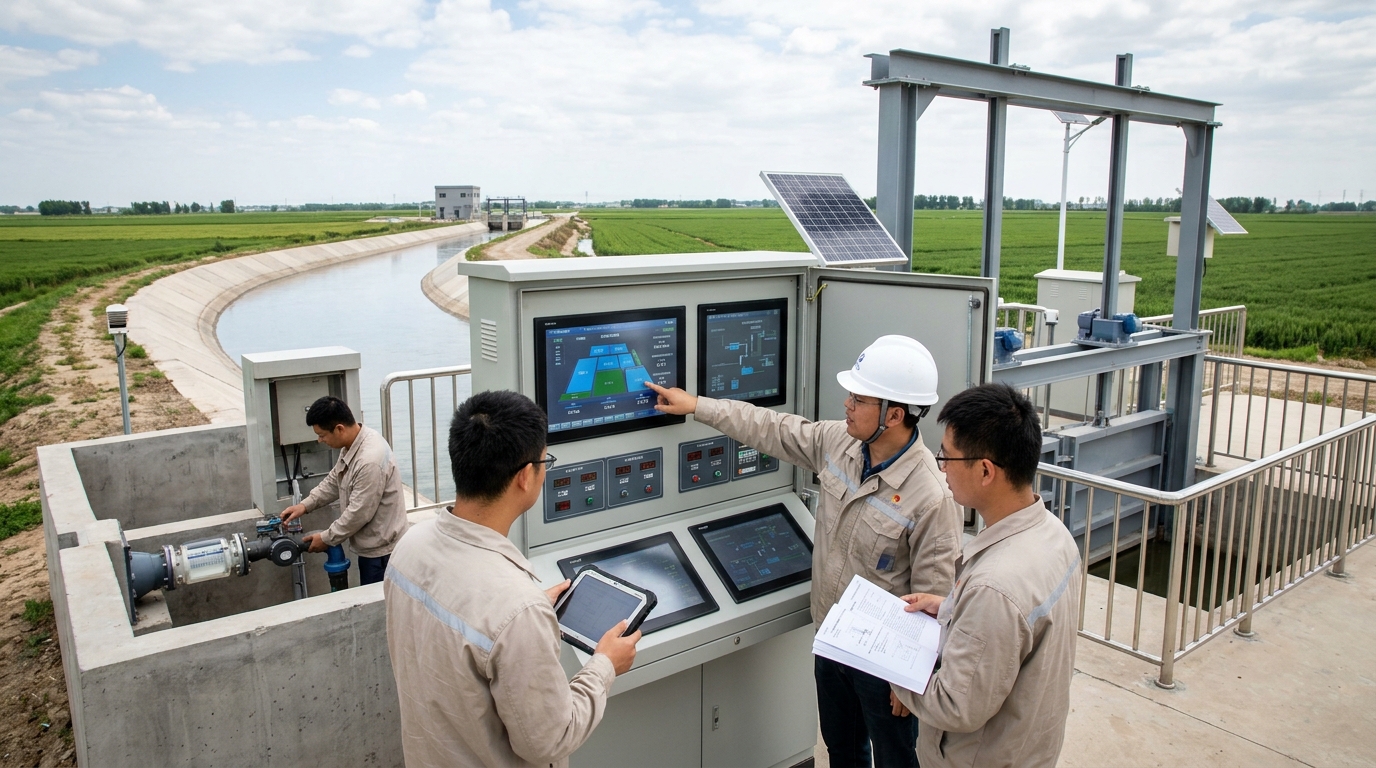
CNY 1.5M - 6M: Includes dozens to hundreds of water measurement points, electric gates, soil moisture, video, and data platforms.
Large Districts
CNY 10M - 50M+: Involves dispatch models, data middle platforms, security systems, digital twins, and provincial integration.
Market procurement entities are also changing. Different entities understand informatization objectives quite differently: management departments focus on water measurement coverage and audit trails; agricultural operating entities focus on convenience and cost controllability; O&M units care about reliability and open interfaces. Therefore, simply comparing the “number of software functions” is no longer sufficient to judge project value.
II. Product Price Ranges: Clear Stratification
Pricing usually comprises front-end sensing, control execution, communication transmission, software platform, integration implementation, and O&M services. Below is a breakdown of typical costs per unit/set:
| Category | Device Type | Price Range (CNY) | Notes |
|---|---|---|---|
| Water Measurement | Water Level Gauges | 1,500 - 6,000 / unit | Canals, reservoirs, gate upstream/downstream. |
| Ultrasonic Open-Channel Flow Meters | 3,000 - 12,000 / set | Common in small/medium canals. | |
| Radar Flow Meters | 4,000 - 15,000 / set | High non-contact, anti-siltation. | |
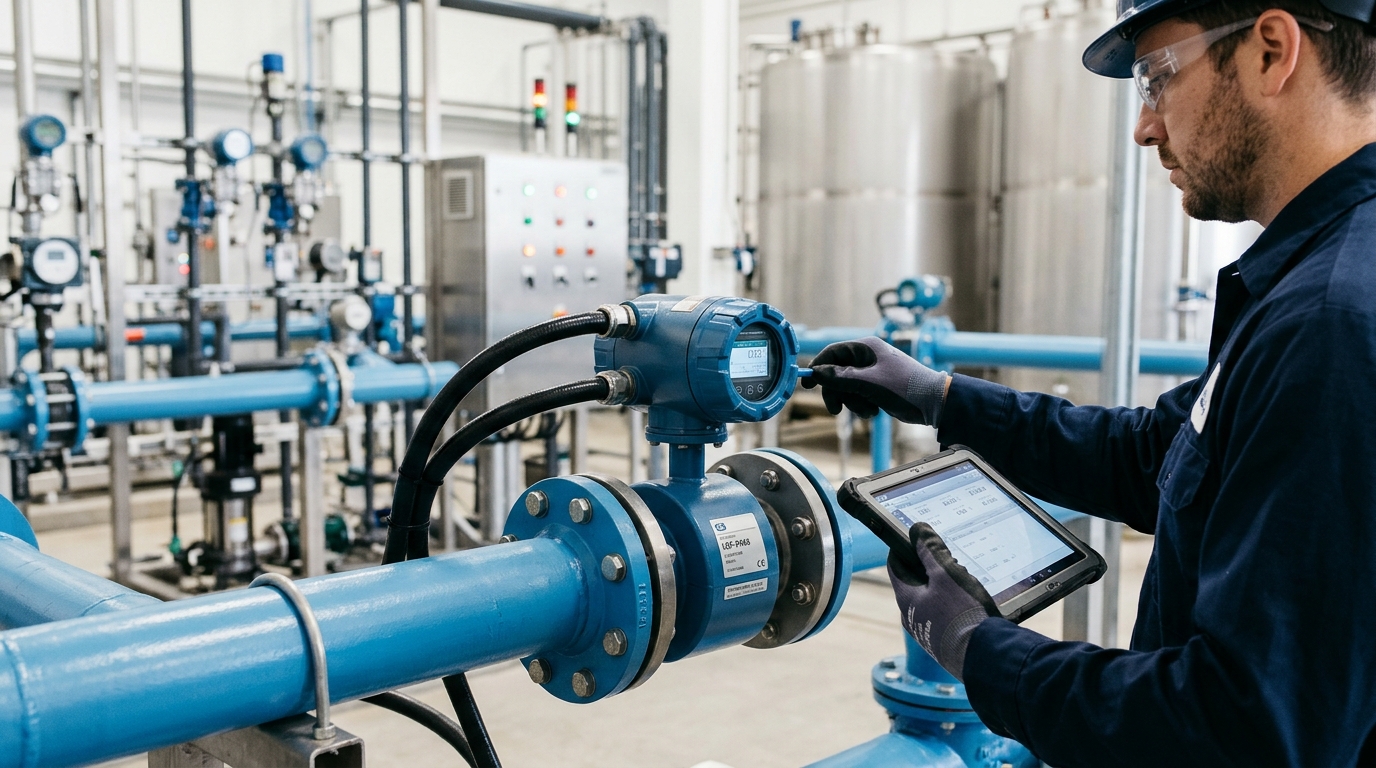
| Electromagnetic Flow Meters | 8,000 - 50,000 / set | Depends on diameter/material/protection. | |
| Control & Actuation | Electric Gate Control Cabinets/RTUs | 8,000 - 45,000 / unit | Depends on motor power/protocol. |
| Field Smart Irrigation Controllers | 2,000 - 8,000 / unit | Basic local automation. | |
| Soil Moisture Monitoring Terminals | 800 - 3,000 / set | Essential for precision irrigation. | |
| Small Weather Stations | 8,000 - 40,000 / set | Meteorological data input. | |
| Software Platform | Lightweight Management Platform | 100,000 - 400,000 | Display and statistics only. |
| Medium/Large Integrated Platform | 300,000 - 1.2 Million | Dispatch, alarms, mobile, interfaces. | |
| Advanced Platform (Digital Twin/AI) | > 1.5 Million | Includes security assessment/private deploy. |
Procurers should note that if a low-price platform lacks open interfaces and sustained O&M capabilities, later expansion costs may far exceed the initial savings. Annual software service fees typically cost CNY 50,000 to 300,000 per year.
III. Key Parameter Analysis: Accuracy, Protection, and Power
Parameter selection directly affects data usability and long-term costs. Nominal accuracy does not equal actual accuracy if site conditions are poor.
- Accuracy Requirements: Water level gauges need ~1cm accuracy. Radar flow meters: ±2% to ±5%; Ultrasonic: ±3% to ±5%; Electromagnetic: ±0.5% to ±1% in pipelines. Consider cross-section regularity and installation location.
- Protection Ratings: Common outdoor equipment should reach IP65 or IP66. Underwater sensors or flooded scenarios require IP68.
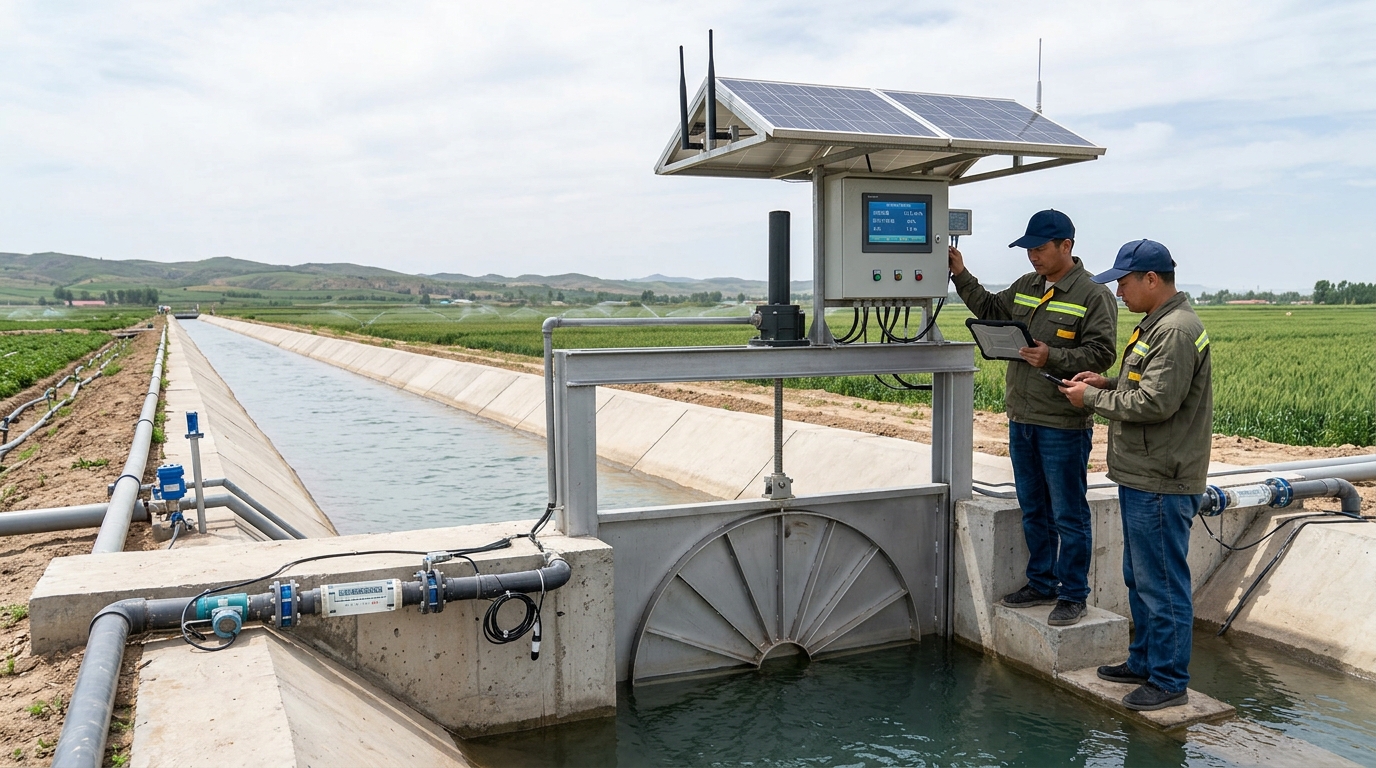
- Power Supply: Solar panels commonly 30W-80W; Batteries 100Ah-200Ah. Autonomy during overcast/rainy weather should be designed for 7 to 15 days.
- Communication: NB-IoT/4G for suburban areas; LoRa/BeiDou for remote sections. Critical nodes must retain local control capability.
- Data Interfaces: Support MQTT, HTTP, Modbus, OPC UA, and GB/T protocols to avoid vendor lock-in and facilitate third-party integration.
IV. Procurement Recommendations: Solution Selection Strategy
Clarify “what problem needs to be solved” before choosing equipment.
Objective: Metering & Fees
Prioritize water measurement systems at critical cross-sections (intakes, main canals). Ensure continuous, accurate, traceable data.
Objective: Water Saving
Combine metering with soil moisture, smart irrigation controllers, and integrated water/fertilizer application. Avoid "visible" platforms without "executable" control.
Objective: Dispatch Safety
Strengthen video surveillance, gate status monitoring, water level warnings, and emergency command functions.
Four Practical Indicators
1. Measurability
2. Controllability
3. Maintainability
4. Scalability
For limited budgets, prioritize building water measurement and key gate control first, then gradually expand to smart irrigation and dispatch models. Do not pursue complex systems that are difficult to maintain.
V. Maintenance Cost Analysis: Total Cost of Ownership
A common misconception is focusing only on construction quotations. Industry experience shows annual hardware maintenance costs are typically 8% to 15% of equipment value, while software service fees are 10% to 25% of contract value.
- Communication Costs: Approx. CNY 5-30 per point/month. For 100 points + 20 gate controls, annual costs range CNY 12,000-43,000.
- Calibration: Essential for data credibility. Small projects: CNY 2,000-10,000/year; Medium: CNY 10,000-50,000/year.
- Failure Factors: Dust on solar panels, battery degradation, lightning strikes, siltation, weed obstruction, and SIM card arrears. Spare parts reserves should be 3%-5% of total equipment quantity.
VI. Typical Case: Input-Output Estimation
A medium-sized irrigation district (120,000 mu) invested CNY 4.2 million in informatization, including 86 water measurement points, 24 gate controls, and an integrated platform.
Results After One Year:
- Metering Coverage: Increased to 92% at key cross-sections.
- Water Utilization Coefficient: Improved from 0.58 to 0.72.
- Water Savings: Per mu usage decreased by ~35 m³; overall rate ~18%.
- Efficiency: Electricity expenditure fell by 12%; inspection labor hours dropped by 40%.
- ROI: Annual direct savings ~CNY 1.1 million; static payback period ~4.8 years.
Establishing a clear indicator system (metering coverage, data completeness, online rate, error rates) during the feasibility phase is crucial for judging investment effectiveness.
VII. Risks and Compliance: Security and Standards
Data security and permission management must be designed up front. Projects involving water fee settlement require tiered permissions, audit trails, and backup mechanisms.
- Open Architecture: Require open interfaces, data dictionaries, and source code escrow to avoid "obsolete upon completion."
- O&M Responsibilities: Clearly define who handles on-site inspection, platform maintenance, data verification, and communication coordination to prevent situations where "data is online but cannot be controlled."
- User Participation: Establish mechanisms so the system serves as an open, transparent platform for water users, not just a management tool.
VIII. Outlook: Entering the Refined Stage
Irrigation district informatization will shift from “construction-oriented” to “operational-quality-oriented.” Basic monitoring prices will remain competitive, while advanced projects relying on dispatch models and data governance will depend on long-term service capabilities.
Future systems will link smart irrigation with crop water requirements, weather forecasts, and water rights trading. Those who can turn data into executable dispatch actions and quantifiable cost benefits will form stable value in the next stage of the market. The competitive focus is shifting from equipment price to full-lifecycle service capability.