Park Energy Management Enters the System Optimization Stage
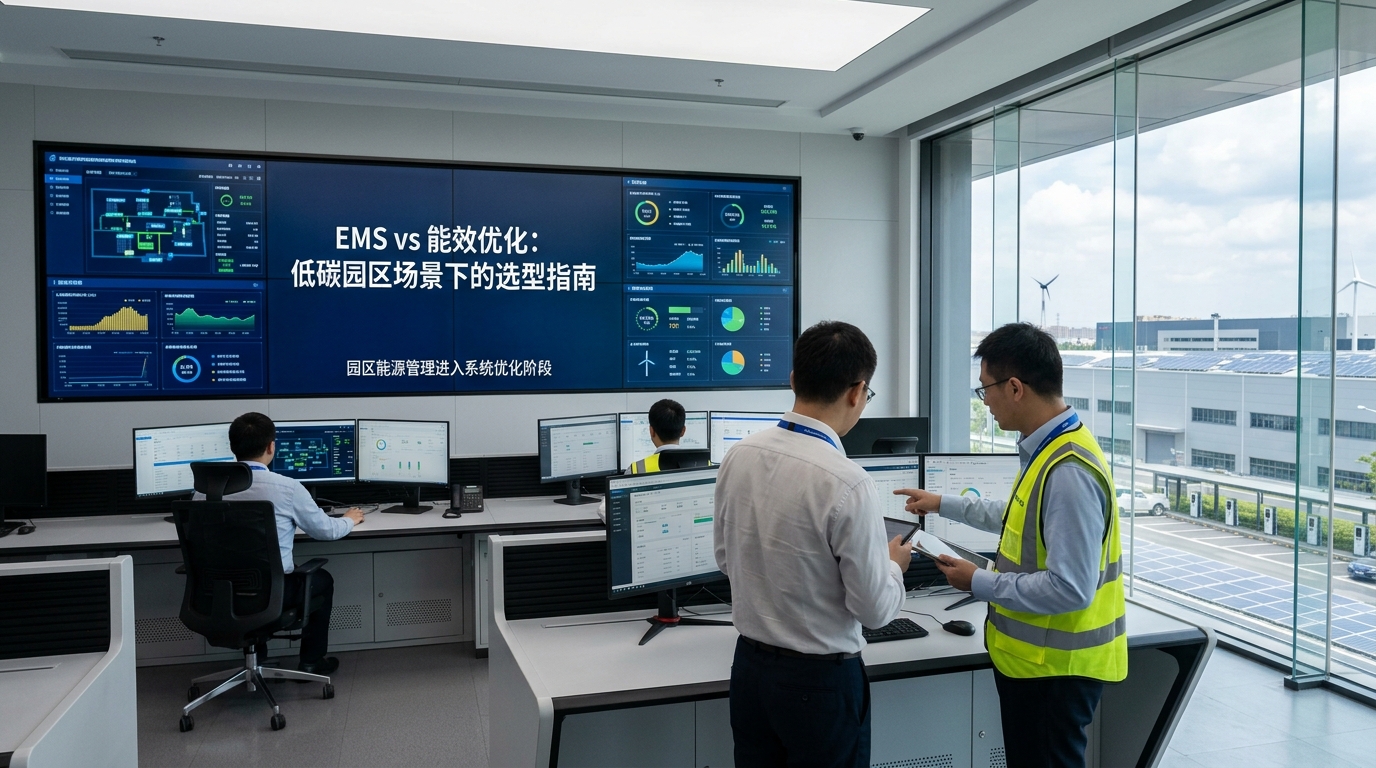
Under the combined drivers of the "dual-carbon" targets, electricity tariff marketization reform, and the need for refined park operations, energy management in scenarios such as industrial parks, business parks, commercial complexes, and data centers is shifting from simple meter reading, statistics, and energy-saving retrofits to system-level energy efficiency optimization centered on EMS. Previously, the focus of park energy management was usually installing electricity, water, and gas meters to generate monthly reports; now, parks must simultaneously address safety, stability, cost, carbon emissions, green electricity consumption, and asset operations. Energy management is no longer merely a task for the equipment department, but a comprehensive engineering effort involving production, property management, tenant recruitment, finance, and supply chain.
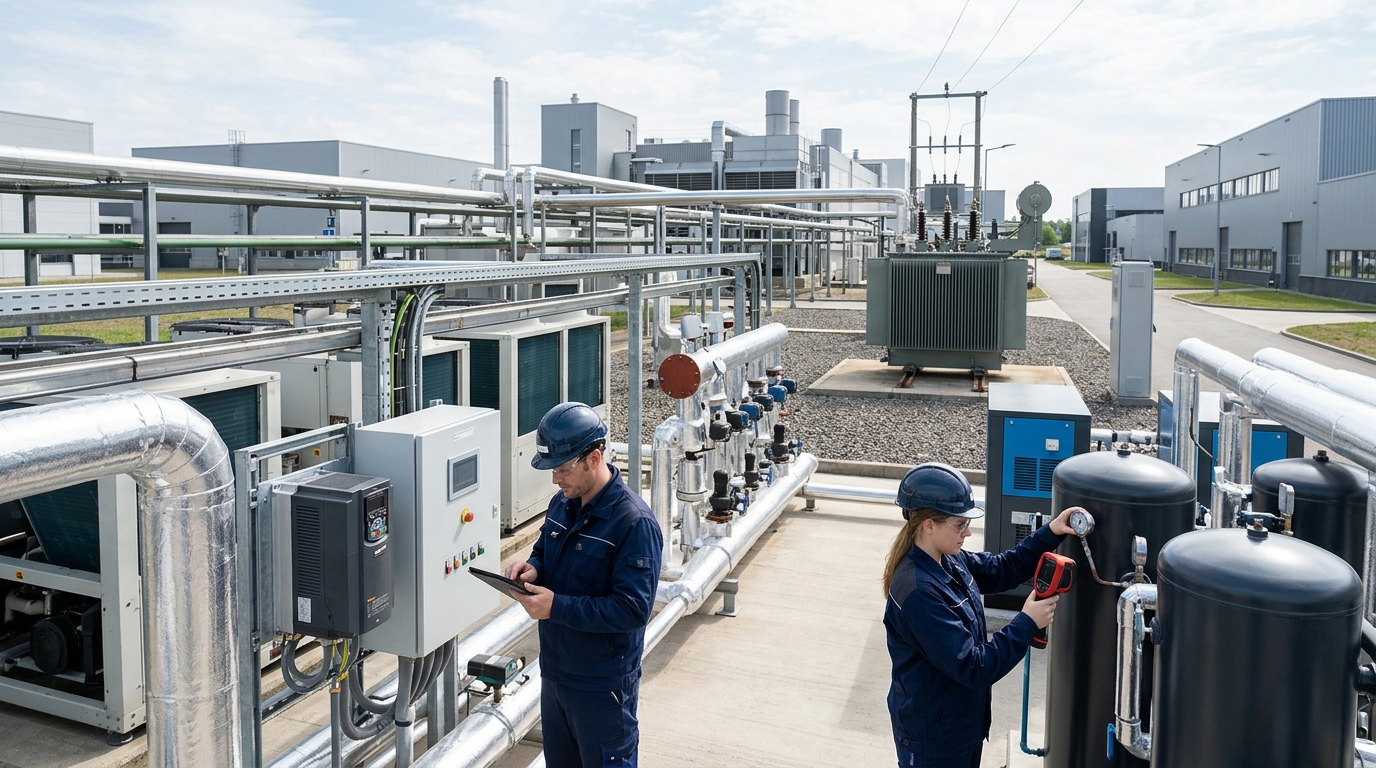
From industry practice, park energy consumption differences are significant: manufacturing-oriented parks mainly use electricity, steam, compressed air, and process cooling, with loads strongly correlated with production plans; commercial parks mainly use HVAC, lighting, elevators, and EV charging, with energy consumption affected by weather and footfall; data centers mainly use cooling and power supply and distribution, with PUE as the core metric. Different energy structures mean technology pathways cannot be simply replicated. This article focuses on keywords such as EMS, energy efficiency optimization, energy saving, and dual carbon, compares the major current technology pathways for park energy management, and analyzes their parameter characteristics, applicable scenarios, and selection boundaries.
Route 1: Traditional BMS/SCADA and Basic Monitoring Retrofit
Traditional BMS (Building Management System) and SCADA (Supervisory Control and Data Acquisition) are early forms of park energy management. Their typical architecture includes field instruments, PLC/DDC/RTU, communication gateways, host computers, and databases, collecting electricity, water, gas, heat, and cooling data through protocols such as Modbus, BACnet, OPC UA, and MQTT. Sampling frequency is usually 1 to 15 minutes, and control logic is mainly based on local thresholds, time schedules, and equipment interlocking. The advantages of this route are stability, good real-time performance, and low network dependency, making it suitable for parks with existing automation foundations and high safety requirements.
However, the traditional route also has obvious shortcomings. First, systems are often split by building, production line, or equipment vendor, forming siloed architecture with inconsistent data definitions, making cross-system optimization difficult. Second, analytical capability is weak: most systems can only present historical curves and reports, lacking load forecasting, anomaly diagnosis, and strategy recommendations. Third, retrofit costs are not low; legacy devices with non-open protocols and incomplete metering hierarchies often require adding smart meters, gateways, and edge computing boxes. Industry project experience shows that for a light industrial park of about 100,000 m², if 800 electricity meters, 100 temperature or pressure sensors, and 20 gateways are connected, retrofit investment is typically RMB 300,000 to 800,000, with an implementation period of 1 to 3 months. After basic monitoring goes live, manual meter reading workload can be reduced by 70% to 90%, but monitoring alone usually yields an energy saving rate of 2% to 4%; more value is realized through data transparency and O&M response.
For parks with many instruments but no unified platform, this route remains a pragmatic starting point. It can help parks first solve the questions of whether data exists, whether data definitions are accurate, and whether alarms are timely. However, if the park's goal is only to reduce electricity bills or complete carbon accounting, traditional BMS/SCADA is usually insufficient to support subsequent energy efficiency optimization, and an upgrade to EMS, data governance, and intelligent strategies is required.
Route 2: Choosing Between Cloud EMS and On-Premises EMS
Cloud EMS is one of the fastest-expanding routes for park energy management in recent years. Its characteristics are that device connectivity, data storage, analytics dashboards, and O&M work orders are implemented through a cloud platform, allowing parks to subscribe to modules on demand, such as energy consumption statistics, sub-metering, demand analysis, anomaly alarms, carbon accounting, and energy efficiency dashboards. For multi-park operators, chain commercial properties, logistics parks, and light industrial plants, cloud EMS has a clear deployment speed advantage. Common implementation periods are 2 to 6 weeks, and fees can be subscription-based according to access points, building area, or functional modules. In industry practice, the annual service fee is approximately RMB 10,000 to 30,000 per 10,000 m², or RMB 50 to 200 per collection point per year, depending on device quantity, network conditions, and whether on-site O&M is required.
The advantages of cloud EMS are low construction threshold, rapid version iteration, and convenient remote diagnostics, making it suitable for bringing dispersed parks into unified control. Its risks include network dependency, data sovereignty, and long-tail device connectivity costs. If a park requires minute-level control, internal network isolation, or involves production safety, the cloud solution needs edge gateways for local caching and store-and-forward during network outages. On-premises EMS deploys servers, databases, and applications in the park server room or private cloud, suitable for chemical, power, semiconductor, and data center scenarios with high continuity and security requirements. On-premises deployment investment is usually RMB 800,000 to 3,000,000, with an implementation period of 3 to 9 months, and subsequent O&M is shared by the park IT and energy teams.
In terms of case studies, a chain industrial park adopted cloud EMS to connect three parks totaling 360,000 m², with 1,800 data points. The first-year service fee was about RMB 420,000, and after one year of operation, comprehensive energy consumption decreased by about 5.2%, with HVAC and public lighting contributing about 60%. A chemical park adopted on-premises EMS, connecting steam networks, compressed air, and circulating water systems, with an investment of about RMB 1.8 million. Through balance forecasting and alarm interlocking, annual standard coal savings reached about 1,200 tons, with a payback period of about 3 to 4 years. The two solutions are not absolutely better or worse; the core differences lie in data sensitivity, control real-time performance, and O&M organization model. When choosing between cloud and on-premises, one should also assess store-and-forward, dual-server hot standby, log auditing, disaster recovery, and tenant data isolation capability.
Route 3: AI Energy Efficiency Optimization and Digital Twin
AI energy efficiency optimization builds on EMS data to further address the question of "how to operate better." Common applications include chiller group control, HVAC terminal unit optimization, air compressor variable-frequency drive and pressure setpoint optimization, lighting strategies, EV charging load management, production load forecasting, and demand control. The technical pathway usually includes data cleansing, feature engineering, load forecasting, optimization algorithms, and closed-loop control. Digital twin models the park energy system with building, equipment, process, and weather data, and is used to simulate different operating strategies, for example adjusting chilled-water supply temperature, changing cold storage periods, or optimizing steam balance.
The key to the AI route is not the algorithm name, but data quality and control boundaries. It generally requires at least 3 to 6 months of minute-level operational data, including energy consumption, equipment status, weather, production plans, or footfall data. The modeling and validation period is usually 2 to 4 weeks, and the on-site trial run is 1 to 3 months. If devices lack adjustable interfaces, or if the owner does not allow algorithms to directly control equipment, the system can only provide recommendations, and benefits will decrease significantly. Industry projects show that AI optimization can achieve 5% to 15% energy savings in HVAC systems, 3% to 8% in compressed air systems, and in mixed-use parks, if HVAC, lighting, power, and demand management are coordinated, the overall energy saving rate is mostly 2% to 8%.
A typical case is a data center. The project had an original PUE of about 1.48, with main energy consumption from chillers and pumps. After the AI optimization system connected cooling towers, chillers, pumps, HVAC terminal units, and IT load data, it dynamically optimized chilled-water supply temperature, frequency, and start/stop combinations. Based on an estimated IT load of about 9 million kWh, the original PUE of 1.48 corresponded to total annual electricity consumption of about 13.32 million kWh; after optimization, PUE dropped to about 1.35, corresponding to total annual electricity consumption of about 12.15 million kWh, annual electricity savings of about 1.17 million kWh, cooling-related electricity consumption decreased by about 17%, and the payback period was about 2.5 to 3.5 years. Another case is a logistics park that used AI lighting and HVAC interlocking, adjusting zoning lighting and cooling according to warehouse operation plans. The comprehensive energy saving rate was about 6.5%, while ineffective nighttime lighting was reduced by about 20%. The AI route is suitable for parks with a large number of devices, high operational variability, and adjustable loads, and is not suitable for small-scale scenarios that can be solved merely by replacing high-efficiency equipment.
Route 4: Source-Grid-Load-Storage Integration and Microgrid
Source-grid-load-storage integration is an important route that extends park energy management from the energy-use side to the supply side. Its core is to coordinate distributed PV, energy storage, EV charging, controllable loads, grid interfaces, and energy dispatch systems within the park to form a microgrid or virtual power plant node. Typical configuration includes rooftop PV, behind-the-meter energy storage, smart distribution cabinets, demand controllers, load forecasting, and dispatch strategies. For parks with large peak-valley electricity price differences, high basic demand charges, green electricity demand, or participation in demand response, the benefits of this route are more obvious.
In terms of parameters, in regions with good solar resources such as East and South China, a 1,000 m² rooftop can typically install about 100 to 150 kW of PV modules, and annual generation for 1 MW is about 1 to 1.3 million kWh, depending on orientation, shading, and O&M. Storage capacity is often configured for peak shaving, valley filling, and demand management goals. A 1 MWh storage system, considering depth of discharge and conversion efficiency, can release about 700 to 900 kWh during a single peak discharge. If the peak-valley price spread is RMB 0.6 to 0.9 per kWh, annual arbitrage potential is affected by charge/discharge cycles, tariff policies, and battery degradation. Demand management can reduce monthly maximum demand through storage discharge and load shifting; some parks can reduce basic demand charges by 10% to 20%. The higher the PV self-consumption ratio, the better the economics; if the grid feed-in tariff for surplus electricity is low, benefits will be weakened. In terms of safety, energy storage must meet fire protection, thermal management, grid-connection protection, and incident isolation requirements.
An industrial park built 5 MW rooftop PV and 2 MWh energy storage, with annual generation of about 5.2 million kWh and a self-consumption rate of about 72%. After coordinating demand control with EMS, peak basic demand charges decreased by about 18%, and the overall payback period was about 6 to 8 years. Another park participated in provincial demand response, with a single response capacity of about 300 kW; calculated at compensation of RMB 3 to 5 per kW, annual revenue reached hundreds of thousands of RMB. The advantages of the source-grid-load-storage route are energy autonomy, green electricity consumption, and asset returns, but the disadvantages are also prominent: high initial investment, strict safety standards, complex dispatch strategies, and benefits dependent on tariff policies, load curves, and O&M level. It is suitable for medium and large parks with stable loads, rooftop resources, storage budgets, and energy operation capabilities.
Route 5: Carbon Management and Dual-Carbon Compliance Platform
Dual-carbon targets drive park energy management from reducing energy consumption to reducing carbon emissions. Carbon management platforms are usually based on EMS energy consumption data, combined with Scope 1, Scope 2, and Scope 3 accounting boundaries, converting data such as electricity, natural gas, steam, diesel, and refrigerant leaks into carbon emissions. Key capabilities include emission factor library, organizational boundary management, product carbon footprint, green electricity and green certificate retirement, carbon asset ledger, and disclosure reports. For export-oriented manufacturing enterprises, automotive supply chains, internet parks, and industrial parks requiring tenant recruitment ESG evaluation, carbon management has become part of the infrastructure.
In terms of technical pathway, a carbon management platform can be built independently or as an EMS module. Typical implementation period is 1 to 3 months, with investment of about RMB 100,000 to 500,000, depending on the number of data sources, complexity of accounting boundaries, and whether it is integrated with third-party audit. Direct energy-saving effects are usually limited, but compliance and trading value are clear. Taking indirect electricity emissions as an example, if a national grid average emission factor of about 0.57 kg CO2 per kWh is adopted, a park with annual electricity consumption of 120 million kWh has Scope 2 emissions of about 68,400 tons of CO2. If 100 million kWh is offset through green electricity trading or green certificate retirement, it corresponds to offsetting about 57,000 tons of CO2, with the specific calculation subject to the latest policy definitions. Emission factors for steam and natural gas are calculated based on fuel lower heating value, carbon emission factor, and boiler efficiency.
After an export-oriented park built a carbon management platform, it centrally collected tenant electricity meter data, PV self-generation data, green electricity purchase contracts, and steam energy consumption data, completing an annual organizational carbon inventory. The platform found that about 35% of carbon emissions came from Scope 2 electricity, about 25% from steam, and about 20% from Scope 3 estimates such as employee commuting and logistics. Based on this, the park prioritized rooftop PV, green electricity procurement, and tenant energy efficiency retrofits, and established a tenant carbon intensity ranking. The carbon management route is suitable for parks with disclosure, supply chain, or carbon allowance requirements, and is not suitable for scenarios where electricity cost savings is the sole goal. Its long-term value lies in converting energy data into auditable carbon assets.
Comparison and Selection Recommendations: Cost, Benefits, and Scenario Matching
From the perspective of investment intensity, traditional BMS and basic monitoring retrofit usually range from RMB 300,000 to 1,000,000, with an implementation period of 1 to 3 months; the main value is metering transparency and alarm response. Cloud EMS has a lower first-year investment and is suitable for rapid replication across multiple parks, but long-term subscription costs need to be included in budgets. On-premises EMS has high upfront investment and is suitable for critical loads and safety-sensitive scenarios. AI energy efficiency optimization investment is about RMB 300,000 to 1,500,000, with benefits dependent on device adjustability and data quality. Source-grid-load-storage investment can reach tens of millions of RMB, with a payback period of 5 to 10 years. Carbon management platform investment is relatively smaller, but it requires high-quality energy data support.
From the perspective of benefit structure, basic monitoring and carbon management lean more toward compliance and management benefits, with direct energy saving rates usually below 5%. Cloud EMS and on-premises EMS, through sub-metering, anomaly diagnosis, and O&M optimization, can achieve comprehensive energy savings of 3% to 8%. AI optimization can achieve local energy savings of 5% to 15% in HVAC, compressed air, data center cooling, and similar scenarios. Source-grid-load-storage benefits come from electricity cost reduction, demand management, peak-valley arbitrage, green electricity self-consumption, and demand response; comprehensive electricity cost reduction may reach 10% to 25%, but capital expenditure is higher. When selecting, one should not only look at energy saving rate, but also consider payback period, O&M complexity, data security, tenant cost allocation, and carbon compliance requirements.
From the perspective of applicable scenarios, parks with many instruments but no unified system should prioritize completing data acquisition and BMS/SCADA upgrades. Multi-park operators, light industry, and commercial complexes are suitable for cloud EMS plus energy efficiency dashboards. Chemical, power, semiconductor, and data center scenarios are suitable for on-premises EMS and real-time control. Parks with large load variability, adjustable devices, and accumulated historical data are suitable for AI energy efficiency optimization. Parks with good rooftop resources, large peak-valley price spreads, storage budgets, and green electricity demand are suitable for source-grid-load-storage. Parks with export supply chains and heavy ESG disclosure pressure should build carbon management modules simultaneously. A more reasonable implementation sequence is usually: metering first, analysis second, optimization third, assetization fourth. If the data foundation is insufficient, directly adopting AI or source-grid-load-storage easily becomes "platform without benefits".
Project risk control is equally important. Common risks in park energy management include missing metering hierarchy, unclear tenant data allocation, legacy devices with non-open protocols, unclear algorithm control boundaries, and insufficient delineation of cybersecurity responsibilities. It is recommended that owners specify metrics in tender documents or project contracts: sub-metering coverage rate, data acquisition completeness rate, alarm response time, energy saving rate calculation method, PUE or energy consumption per unit product, demand reduction ratio, carbon accounting error range, and acceptance period. For systems involving production safety, manual confirmation, safety interlocks, and degradation strategies should be set to avoid energy optimization affecting process stability. In addition, parks should establish energy data governance mechanisms, clarifying collection standards, naming rules, unit conversion, tenant allocation, and audit trail. Without energy consumption data with unified definitions, it is difficult to support energy savings verification and carbon accounting.
Outlook: From Energy Consumption Monitoring to Energy Asset Operations
In the future, competition in park energy management will shift from device connectivity capability to data governance, operating strategies, and asset return capability. As electricity spot markets, green electricity trading, demand response, virtual power plants, and carbon markets gradually mature, parks will no longer be merely single energy consumers, but may become aggregation nodes for distributed energy, energy storage, EV charging, and adjustable loads. The role of EMS will also upgrade from "visible" to "accurately calculated, adjustable, controllable, and tradable". At the technology level, edge computing, IoT security, equipment predictive maintenance, multi-energy complementary dispatch, and AI agents will gradually enter park scenarios.
For parks, there is no absolute advantage among technology routes; the key is matching their own energy structure, load characteristics, investment capability, and management boundaries. Small parks can start with basic metering and cloud EMS; medium parks can add AI optimization and demand management; large parks can plan source-grid-load-storage and carbon asset platforms. As dual-carbon policies, electricity tariff mechanisms, and digital standards continue to improve, park energy management will become closer to long-term asset operations: it must not only reduce the cost of every kWh, but also make every ton of carbon emissions, every kWh of green electricity, and every load adjustment quantifiable, auditable, and optimizable.