Complete Guide to Installation and Commissioning of Radar Level Gauges
Introduction: From Measurement Principles to Field-Executable Specifications
Radar water level gauges have become common equipment for non-contact, high-precision, real-time monitoring in water resources, municipal, environmental protection, and mountain flood warning scenarios. Their core principle often uses 80 GHz frequency-modulated continuous wave (FMCW) radar. Compared with traditional methods, these sensors are less affected by sediment, oil contamination, and corrosive media.
Pre-Installation Assessment: Site Conditions Determine Parameter Configuration
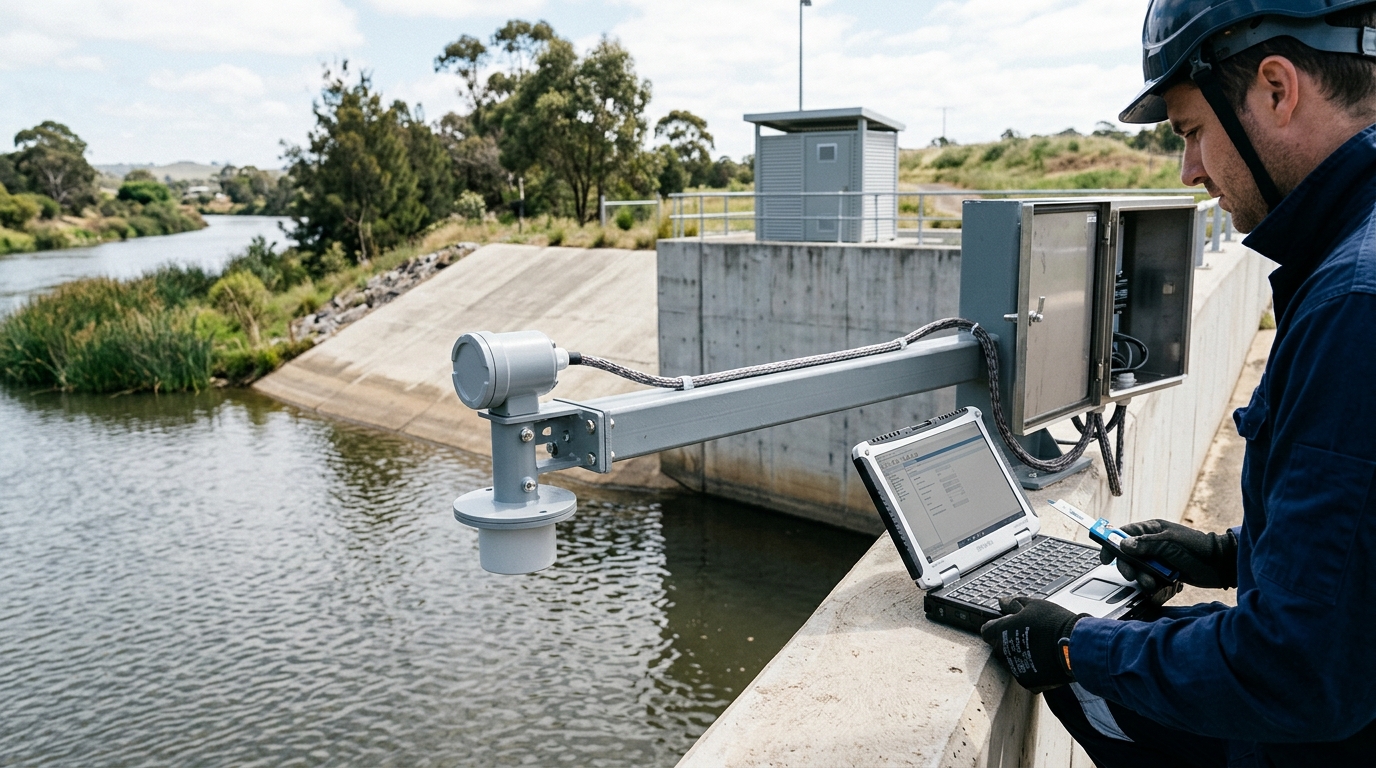
Before installing a radar water level gauge, a site assessment must be completed first. The assessment should cover measurement range, water surface fluctuations, obstructions, power supply conditions, communication conditions, lightning protection environment, and maintenance accessibility.
Range & Blind Zone
- Common ranges: 0–8 m, 0–15 m, 0–30 m.
- Blind Zone: Typically 0.2–0.5 m. Ensure sensor-to-max-water distance > blind zone length.
- Safety Margin: Leave 1.0–1.8 m above historical max water level.
Power & Communication
- Power: AC 220V→DC or Solar (100W panel + 12V 100Ah battery).
- Comms: RS485, 4–20 mA, 4G, NB-IoT, LoRa based on bandwidth/power needs.
Note: For under-bridge installations, avoid oblique radar beams striking bridge piers or guardrails. Keep tilt angle within 1 degree.
Installation Steps: Mechanical Fixing, Electrical Connection, and Protection
Follow the sequence: "Structure first, electrical second, protection third."
Foundation Bracket Installation
Use 304 stainless steel or hot-dip galvanized steel. Avoid ordinary steel on damp riverbanks. Expansion bolts M10/M12, spacing ≤500 mm. Pole diameter ≥89 mm if pole-mounted.
Sensor Body Installation
Antenna diaphragm must face downward and be perpendicular to the water surface. Measure distance from sensor bottom to datum using steel tape; error controlled within 2 mm.
Lightning Protection and Grounding
Grounding conductor ≥16 mm² copper wire; resistance ≤4 ohms. Install surge protective devices on signal/power lines.
Power and Communication Wiring
Protect cables with conduit. Use twisted-pair shielded cable for RS485 (ground shield at one end). Position 4G antenna away from metal brackets.
Identification and Records
Affix unique ID, elevation, range, blind zone, comm address, and commissioning date for traceability.
Commissioning Methods: Zero Calibration, Echo Quality, and Comparative Testing
Step 1-3: Basic Setup
- Power-on Check: Verify stable 12–24 V DC voltage.
- Parameter Setting: Configure range, blind zone, sampling period (1s–1min), and baud rate.
- Zero Calibration: Set air reference height (sensor bottom to staff gauge zero). Do not just enter current water level.
Step 4-6: Verification
- Echo Quality: Signal quality should be >70. If <50, check obstructions/cleanliness.
- Dynamic Adjustment: Use moving average/median filtering for waves. Set window 10–60s (shorter during floods).
- Comparative Testing: Run 24h test against manual staff gauge. Acceptable field deviation: ±2 cm.
Daily Maintenance: Inspection Items and Cycles
Radar gauges are not maintenance-free. Establish a cycle: Monthly inspections, Quarterly comparative testing, Annual lightning protection testing, and Post-rainstorm special inspections.
| Cycle | Key Actions |
|---|---|
| Monthly | Clean diaphragm (soft cloth/neutral cleaner); check bracket stability, grounding integrity, solar/battery status, and platform online rate. |
| Quarterly | Compare radar data with manual staff gauge readings to detect drift trends (bracket settlement, zero offset). |
| Annual | Measure grounding resistance; inspect lightning rod corrosion; verify surge protective device function. |
| Post-Rainstorm | Check for floating debris, sediment impact, equipment tilt, and communication interruptions within 24h. |
Common Troubleshooting: Symptoms, Causes, and Corrective Actions
1. Readings Too High or Too Low
Cause: Incorrect air reference height, blind zone settings, contaminated diaphragm, or sensor tilt.
Action: Remeasure distances, verify platform elevation, clean diaphragm, adjust levelness. Check for obstacles entering echo area.
2. Data Jumps or Spikes
Cause: Waves, raindrops, foam, duckweed, or EMI.
Action: Increase moving average window if signal is stable. Clear floating debris. Adjust installation angle. Check shielding if near high-voltage lines.
3. No Echo or Weak Signal
Cause: Distance out of range/blind zone, sediment coverage, too calm water, or absorbent media.
Action: Confirm distance limits. Clean diaphragm. Enable heating defogging if available.
4. Communication Interruption
Cause: 4G signal/SIM issues, RS485 address conflicts, or 4–20mA loop faults.
Action: Check signal strength/APN. Verify wiring polarity/termination resistance. Measure loop voltage.
5. Power Supply Abnormalities
Cause: Solar battery voltage drop (<11V) due to rain/load.
Action: Measure currents. Increase battery capacity or reduce reporting frequency.
Engineering Cases: Urban River Channels and Reservoir Spillways
Case 1: Urban River Channel
Setup: 12 units, 0–8m range, 4G comms, Solar power.
Issue: Duckweed caused signal quality drop (85→42) and data jumps.
Resolution: Cleared duckweed, adjusted wave-damping plate. Signal recovered (>78). Highlighted importance of incorporating signal quality into O&M loops.
Case 2: Reservoir Spillway
Setup: 3 units, 0–30m range, RS485+4G, strong waves.
Issue: Systematic deviation (1.5cm) after 1 year due to loose bracket bolt causing 2° tilt.
Resolution: Retightened bracket, corrected levelness, recalibrated. Deviation returned to ±3mm. Emphasized structural stability checks.
Conclusion and Outlook: Standardized O&M and Data Closed Loop
As water resources informatization advances, radar level gauge applications expand from single-point measurement to multi-source fusion sensing. Future practical guides should standardize installation acceptance forms, inspection QR codes, and data quality control rules.
Different scenarios require differentiated parameters: Flood warning needs high temporal resolution; urban waterlogging requires linkage with rainfall/video; environmental channels need attention to debris/corrosion. The value lies in long-term stable, interpretable, and traceable data formed through a closed loop of installation, commissioning, maintenance, and troubleshooting.