Development Opportunities for Low-Carbon Industrial Parks in 2026 Under the Dual Carbon Goals
Introduction: Low-carbon parks shift from “meeting energy-saving standards” to “carbon asset operation”
Against the backdrop of China’s continued advancement of the “dual carbon” goals, the ongoing expansion of the national carbon emissions trading market, the transition period of the EU Carbon Border Adjustment Mechanism (CBAM), and the acceleration of green procurement in multinational brand supply chains, low-carbon parks are becoming key vehicles for the green transformation of industries. In the past, park energy-saving work mainly focused on energy consumption per unit of output value, waste heat recovery, lighting retrofit, and boiler efficiency. Today, park managers and resident enterprises face more complex challenges: how to establish verifiable greenhouse gas inventories, how to complete organization-level carbon accounting, how to develop product carbon footprints, how to achieve real-time credible emission data through online monitoring, and how to convert energy-saving and carbon-reduction outcomes into green competitiveness and carbon asset returns.
From an industry observation perspective, the competitive focus of low-carbon parks has shifted from “infrastructure and preferential policies” to “green operation capability and data governance capability.” If a park only has photovoltaic rooftops, energy storage stations, and landscaping, but lacks carbon accounting boundaries, dynamic emission factors, measuring instrument management, and supply chain carbon footprint models, it will find it difficult to meet the multiple requirements of regulators, financial institutions, export customers, and the public. In the next five years, truly forward-looking parks will connect carbon data, energy systems, production management, and financial instruments to form a low-carbon operating system that is “measurable, verifiable, tradable, and disclosable.”
Policy Pull: From Dual Control of Energy Consumption to Dual Control of Carbon Emissions
Policy changes are the primary driver of market trends in low-carbon parks. China’s gradual shift from dual control of energy consumption to dual control of carbon emissions means that the core indicators of park management are no longer limited to total energy consumption and energy intensity, but also include total CO2 emissions, carbon intensity, the share of non-fossil energy consumption, the proportion of green electricity consumption, and accurate accounting of greenhouse gas emissions. The national carbon market already covers the power sector and is expanding to high-emission industries such as steel, cement, and electrolytic aluminum. Public information indicates that the coverage of the expanded national carbon market accounts for approximately 60% of China’s total CO2 emissions, elevating carbon emission data from environmental compliance reports to compliance assets and operating costs.
For parks, the policy impact manifests on three levels. First, park management committees or operating companies need to assume clearer responsibilities for carbon emission statistics and establish greenhouse gas inventories covering Scope 1, Scope 2, and key Scope 3 emissions. Scope 1 typically includes direct emissions from boilers, diesel generators, process emissions, and fugitive emissions within the park. Scope 2 mainly corresponds to indirect emissions from purchased electricity, steam, heating, and cooling. Scope 3 involves broader chains such as raw materials, logistics and transportation, employee commuting, waste treatment, and product use. Second, emission factors and measurement methods need to be standardized. Taking indirect electricity emissions as an example, China’s national average electricity CO2 emission factor in 2022 was 0.5366 kg CO2 per kWh. When calculating Scope 2, parks cannot simply use annual averages, but should conduct more refined calculations by considering green electricity, green certificates, market-based transactions, and dynamic grid emission factors. Third, local pilot programs and industry standards are driving parks from “annual reporting” to “process management,” including near-zero-carbon parks, zero-carbon parks, green electricity demonstration parks, and carbon inclusion mechanisms.
Policy is not merely a one-way constraint; it also creates new tools. Green finance, carbon allowance pledge financing, green bonds, sustainability-linked loans, and pledge financing of carbon asset revenue rights are providing a financing foundation for park energy-saving retrofits.
For example, once a park forms verifiable emission reductions through rooftop photovoltaics, energy storage, and energy efficiency management, it can more easily obtain low-cost funding. Enterprises that reduce product carbon footprints may also obtain preferential interest rates for green credit. The core policy shift is that carbon emissions are no longer an external cost but an explicit indicator entering balance sheets, supply chain admission, and export compliance.
Market Trend: Investment Attraction Logic Shifts to Green Infrastructure
Market trends in low-carbon parks are reshaping the logic of park investment attraction and operations. Traditional park competition relied on land prices, tax rebates, factory subsidies, and labor costs, whereas next-generation low-carbon parks compete on energy structure, carbon data capability, green certification, supply chain coordination, and low-carbon product service capability. For industries such as electronics manufacturing, new energy vehicles, batteries, photovoltaic modules, high-end equipment, textile exports, cold-chain logistics, and data centers, low-carbon parks are no longer merely “image projects”; they are key conditions for winning orders, export compliance, and capital valuation. Multinational customers increasingly require suppliers to provide organizational carbon footprints, product carbon footprints, emission reduction pathways, and third-party verification reports; financial institutions also place greater emphasis on corporate climate risk disclosure.
Green Infrastructure Combinations
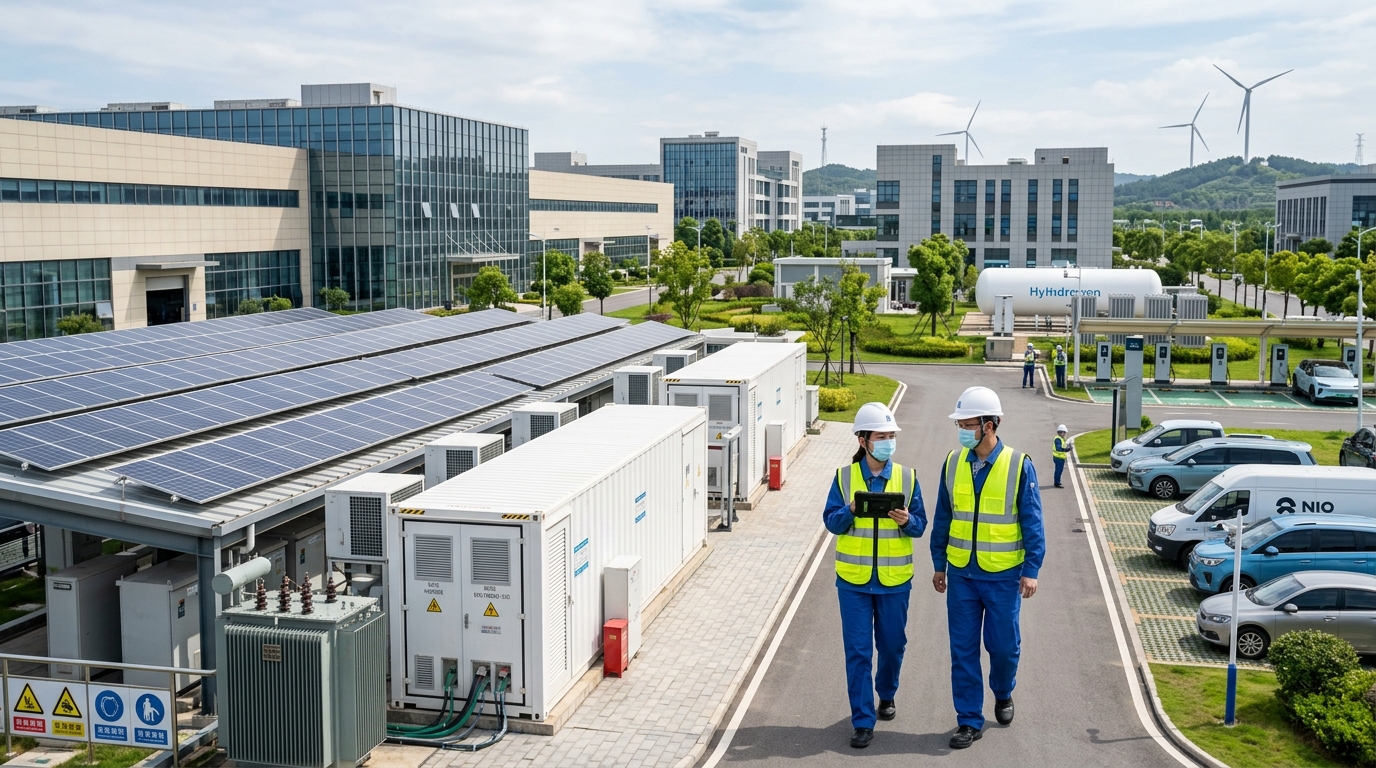
- Distributed photovoltaics & decentralized wind power
- New-type energy storage & smart microgrids
- Waste heat and pressure recovery
- Heat pump systems & EV charging facilities
- Hydrogen refueling/blending infrastructure
- Data center liquid cooling
Case Study: Eastern China Electronics Park
This park features ~8 MW rooftop PV capacity generating ~9.5 million kWh annually. Using the national average emission factor, this reduces indirect electricity emissions by ~5,100 tonnes CO2e/year.
Supporting energy storage optimizes peak-valley arbitrage, while an integrated platform connects electricity, water, gas, and heat data for monthly emission reporting.
The market is also generating new service demand. Park operators need carbon accounting consulting, measuring instrument calibration, online monitoring integration, data governance, green electricity trading, carbon asset management, product carbon footprint certification, and ESG disclosure support. Resident enterprises need to reasonably allocate emissions from park public facilities to their own product costs. In other words, low-carbon parks are transitioning from “landlords” to “green operators,” shifting from providing factories and property management to providing energy, data, certification, and supply chain coordination services.
Technology Direction: Online Monitoring and Digital Twins
The key to technological development in low-carbon parks is turning greenhouse gas emissions from annual estimates into traceable, explainable, and verifiable data flows. Online monitoring is becoming an important infrastructure for park carbon management. Here, online monitoring is not limited to continuous emission monitoring systems (CEMS) measuring sulfur dioxide, nitrogen oxides, and particulate matter; it also includes multi-source data fusion of CO2 concentration, flow rate, temperature, pressure, oxygen content, steam flow, natural gas meters, electricity meters, heat meters, cooling meters, water quality parameters, and spatial sensors. Park-level online monitoring typically requires minute-level sampling frequency, data completeness of no less than 99.5%, deviation at key metering points controlled within 5%, and capabilities such as breakpoint resume, timestamps, anomaly marking, and audit logs.
In a typical chemical industrial park, online monitoring often needs to cover process units, tank farms, loading and unloading areas, wastewater treatment stations, steam pipelines, and site boundary gases. In an integrated energy-carbon project, a chemical park deployed approximately 1,500 smart meters, 12 sets of CEMS, and 200 fixed gas sensor nodes, forming a layered monitoring system of “equipment—pipeline network—boundary—product.” The system can identify steam leaks, metering anomalies, sudden changes in emission factors, and fluctuations in carbon emission intensity. In the past, annual carbon accounting in parks might have relied on monthly bills provided by suppliers and manual meter reading, where errors could easily accumulate. Now, online monitoring moves data from “after-the-fact reporting” to “real-time generation,” providing a foundation for MRV (monitoring, reporting, and verification).
Digital twins and artificial intelligence are the next-stage direction. Parks can map buildings, pipeline networks, photovoltaics, energy storage, charging stations, production lines, and emission sources in three-dimensional models, combining real-time data with energy models to simulate changes in carbon emissions under different operating conditions. For example, when grid load peaks, photovoltaic output declines, or steam demand rises, the system can predict carbon intensity for the coming hours and suggest energy storage discharge, load shifting, or switching to green electricity trading. AI can also be used for anomaly detection: long-term deviations between a company’s electricity meter readings and production load, abnormal nighttime flow in a steam pipeline network, or a sudden increase in carbon intensity per unit product in a workshop may indicate metering faults, leaks, or process fluctuations. The technological value lies not in the number of devices, but in whether a trusted data closed loop can be formed.
Challenges in Carbon Accounting
Carbon accounting is the underlying language of low-carbon parks, but the difficulties often lie not in formulas but in boundaries and evidence. Park carbon accounting must first clarify organizational boundaries and operational boundaries: which emission sources fall under park management, which belong to resident enterprises, which belong to municipal infrastructure, and which belong to indirect supply chain emissions. Unclear boundaries may lead to double counting or omissions. For example, emissions from centralized heating boilers in a park may be borne by heating companies, while metering deviations on the user side can affect enterprises’ Scope 2 calculations. Shared wastewater treatment facilities, data centers, energy storage stations, and charging and battery-swap facilities also require allocation rules. Without a clear method for allocating emissions from public facilities, the park’s carbon ledger tends to remain at the aggregate level and struggles to support enterprise carbon footprints.
Emission factors and dynamic data are equally critical. Traditional carbon accounting often uses fixed emission factors, such as emission factors per unit heat value or per unit electricity for natural gas, diesel, gasoline, electricity, and steam. However, in actual parks, electricity sources, steam quality, production processes, and waste treatment methods can affect emission intensity. Especially for Scope 2, time-related differences among green electricity, green certificates, market-based transactions, and grid emission factors mean that annual averages cannot fully reflect real emission reduction performance. A park once experienced an approximately 8% deviation in annual carbon accounting due to aging steam metering equipment. After correction through online monitoring and cross-validation, it was found that heat meters in some workshops had long-term drift. This case shows that the credibility of carbon accounting depends on measuring instrument management, data cross-checking, on-site verification, and version control.
Scope 3 is the most complex and forward-looking part of park carbon accounting. Scope 3 includes upstream raw materials, outsourced logistics, employee commuting, business travel, waste treatment, product transportation, product use, and end-of-life recycling. For parks, Scope 3 is difficult to attribute fully, but it can be gradually improved through supply chain carbon data platforms, logistics electronic fencing, transportation mileage accounting, employee commuting surveys, waste manifest chains, and life-cycle models. In the future, if parks can connect Scope 3 data with product carbon footprints, supply chain finance, and green procurement, they will shift from “compliance cost” to “management asset.”
Carbon Footprint: From Park Ledgers to Product Passports
Product carbon footprint is a key pathway for the value spillover of low-carbon parks. Organizational carbon footprint answers “how much greenhouse gas the park or enterprise emits in a year,” while product carbon footprint answers “how much a product emits from raw material acquisition, manufacturing, transportation, use, and end-of-life.” Common standards include ISO 14067, PAS 2050, and industry-specific product category rules (PCRs). As the EU CBAM, Battery Regulation, Digital Product Passport, and green public procurement advance, product carbon footprint is moving from voluntary disclosure to an admission threshold. For export-oriented parks, if credible product carbon footprint data cannot be provided, enterprises may face carbon tariff costs, loss of customer orders, or downgraded green supply chain ratings.
The role of parks in carbon footprints is not to replace enterprise accounting, but to provide a public data foundation. Parks can uniformly provide parameters such as green electricity proportion, steam carbon intensity, wastewater treatment allocation, centralized logistics delivery, shared warehousing, and emissions from office facilities, making it easier for enterprises to complete cradle-to-gate or cradle-to-grave calculations. An equipment manufacturing park once established a product carbon footprint model and calculated that the cradle-to-gate emissions of a medium-sized CNC machine tool were about 6.8 tonnes of CO2 equivalent, of which steel and castings accounted for about 55%, purchased electricity for about 18%, and transportation and packaging for about 10%. By promoting recycled steel procurement, green electricity trading, and packaging reduction, the park reduced the carbon footprint per machine tool by about 12%, helping enterprises enter international brands’ green supplier lists.
Carbon footprints also need to address data granularity and mutual recognition. Enterprise-level carbon footprints require equipment-level, process-level, and material-level data, while park-level platforms often only have aggregate data. The future direction is to establish a three-tier carbon data chain of “park—enterprise—product”: parks provide energy and public infrastructure parameters, enterprises provide process and bill-of-materials data, supply chains provide raw material carbon footprints, and certification bodies conduct sampling and verification. If combined with blockchain or trusted timestamps, data tamper resistance and audit efficiency can be further improved. Carbon labels, product digital passports, and supply chain carbon databases will become new service offerings for parks.
Outlook: Zero-Carbon Parks and Systemic Competitiveness
Industry outlooks need to avoid a common misconception: a zero-carbon park does not mean that all emissions within the park instantly become zero, but that net-zero is achieved within specific boundaries and periods through deep emission reduction, green energy, carbon removal, and compliant carbon credits. A truly implementable pathway is usually “first calculate clearly, then reduce emissions, then optimize, then offset.” Parks need to first establish greenhouse gas inventories and carbon baselines, then identify high-carbon segments such as steam boilers, compressed air, cooling, data centers, process heating, logistics, and employee commuting; then reduce emissions through electrification, energy efficiency improvement, green electricity substitution, energy storage, and intelligent dispatching; finally, residual emissions that are difficult to reduce may be addressed through carbon credits, carbon sinks, or CCUS.
Economics-Driven Technology Combinations
- Rooftop PV: Internal rate of return (IRR) of 6%–10% in high-quality projects.
- Energy Storage: Improved returns via peak-valley price spreads (RMB 0.7–1.0/kWh in some provinces).
- Virtual Power Plants: Aggregating adjustable loads for demand response (e.g., 10 MW aggregated load with 15-min response time).
- Heavy Industry Options: Waste heat recovery, electrification, green hydrogen, biomass, and CCUS for chemical/steel/materials parks.
Forward-looking risks are equally evident. Carbon price volatility, changes in green certificate prices, inconsistent verification standards, data privacy, platform lock-in, equipment depreciation, and missing supply chain data may all affect the low-carbon transformation of parks. Enterprises should not view carbon management as a one-off project, but should establish long-term governance mechanisms: appoint a carbon data quality officer, regularly calibrate measuring instruments, build an emission factor version library, conduct internal verification, formulate product carbon footprint improvement plans, and incorporate carbon performance into KPIs for investment attraction, property management, energy, and supply chain. The future competitiveness of parks depends on whether they can turn low-carbon capability into stable, transparent, and auditable service capability.
Conclusion: Building a Closed Loop of “Carbon Data—Energy Systems—Industrial Competitiveness”
Low-carbon parks are standing at the intersection of policy, market, and technology. Carbon accounting provides a common language, carbon footprints connect products with supply chains, greenhouse gas inventories clarify management boundaries, and online monitoring makes data real-time and credible. Parks are no longer merely spatial carriers, but should become nodes of energy systems, data systems, and industrial collaboration systems. For park operators, the next step is not simply stacking equipment, but building integrated energy-carbon platforms and forming a closed loop from metering, data collection, accounting, and verification to disclosure and trading. For resident enterprises, low-carbon capability will directly affect orders, financing, exports, and brand valuation.
Looking toward around 2030, low-carbon parks will exhibit three trends: first, carbon emission management will move from annual reports to real-time ledgers; second, green electricity will move from a traded commodity to a system capability; third, carbon footprints will move from compliance disclosure to product competitiveness. If parks can establish a trusted carbon data foundation early and provide green electricity, energy storage, carbon assets, supply chain carbon management, and certification services around industrial demand, they have the opportunity to upgrade from traditional industrial parks to green industrial infrastructure operators. The ultimate goal of low-carbon parks is not to create concepts, but to use verifiable data, replicable technologies, and sustainable economics to help industries maintain competitiveness under lower-carbon constraints.