How to Choose the Right Carbon Emission Monitoring System? Accuracy and Stability Are Key
As corporate greenhouse gas disclosure, product carbon footprint accounting, regulation of key emitting entities, and international trade compliance requirements continue to advance, carbon emissions monitoring is shifting from “once-a-year” carbon accounting to a multi-technology integration stage. In this new era, processes can be continuously observed, anomalies promptly identified, and products fully traced.
Methods such as carbon accounting, online monitoring, satellite remote sensing, laser sensing, IoT sensors, and life-cycle assessment correspond to different scenarios, including corporate boundaries, point-source emissions, regional atmosphere, leakage plumes, facility grids, and product supply chains. For industry readers, understanding the accuracy, cost, applicable boundaries, and data credibility of different technology roadmaps is more important than simply chasing the concept of “monitoring.”
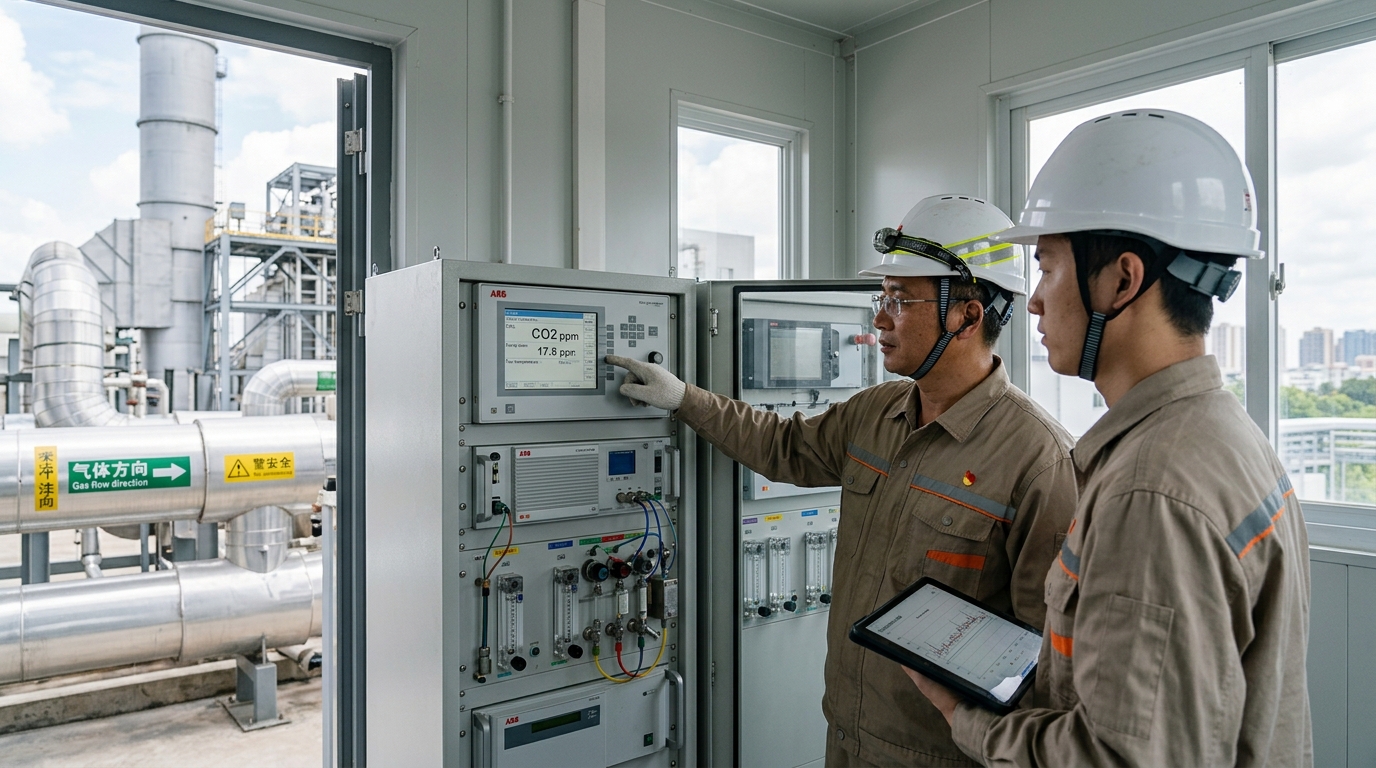
Technology Roadmap Panorama: Distinct Boundaries for Each Method
Carbon emissions monitoring is not a single technology, but a set of complementary data acquisition methods. The core difference among these roadmaps is not merely “accuracy level,” but the different data boundaries they address:
- Carbon Accounting: Answers “how much an enterprise or organization emits in a year” by multiplying activity data (fuel, electricity) by emission factors.
- Online Monitoring (CEMS): Answers “how much a particular stack is emitting at this moment” via continuous measurement of CO2 concentration, velocity, and temperature.
- Remote Sensing & Atmosphere: Answers “whether abnormal emissions exist in a region” using satellites or lasers to identify plumes and hotspots.
- IoT Sensors: Answers “whether a workshop or pipeline is experiencing leakage” through low-cost, high-density sensor networks.
- Carbon Footprint: Answers “how much a product emits over its life cycle,” from raw material to end-of-life.
When selecting a solution, clarify the monitoring objective first: regulatory inventory, energy conservation, product compliance, supply-chain disclosure, or leak detection.
Emission Factor Method: Low Barrier, Auditable, but Dependent on Data Quality
The emission factor method remains the foundational approach for corporate carbon accounting. Its principle is straightforward: for example, if a company’s annual electricity consumption is 1,000,000 kWh and uses a grid emission factor of ~0.57 tonnes CO2e/MWh, Scope 2 emissions are approximately 570 tonnes CO2e. This method does not require expensive stack sensors and is convenient for audit and traceability.
However, shortcomings are evident. Data quality depends heavily on the accuracy of activity data and the applicability of emission factors. In practice, if only default factors are used and metering errors exist, the accounting deviation for Scope 1 or 2 may reach 5% to 15%. Therefore, while suitable for annual disclosure, enterprises needing continuous process optimization must introduce online monitoring or granular process data.
CEMS Online Monitoring: High Precision for Point Sources, High O&M Costs
Continuous Emissions Monitoring Systems (CEMS) are critical for key emitting entities like power plants, cement kilns, and steel mills. A typical system achieves CO2 concentration accuracy of ±1% to ±2% full scale with T90 response times of 10–30 seconds.
Case Study: Cement Industry
After installing CEMS, a clinker line detected CO2 concentration rising from 12% to 15% within 60 seconds due to raw meal decomposition fluctuations—details traditional monthly accounting missed.
Case Study: Steel Industry
Cross-verifying CEMS data with fuel metering reduced Scope 1 accounting deviation from ~8% to around 2% to 3%, proving CEMS helps both "calculate accurately" and "manage effectively."
Despite its advantages, CEMS has high investment and maintenance barriers. It monitors stack outlets but is incomplete for fugitive emissions or complex supply-chain allocations. If sampling locations lack representativeness, mass emission results may still deviate significantly.
Satellite Remote Sensing: Regional Anomaly Detection, Not Corporate Accounting
Satellites like TROPOMI, OCO, and GOSAT provide a broad, independent perspective. They can identify regions where CO2 or CH4 concentrations are elevated by 15% to 25% relative to background levels. This is valuable for policy assessment and risk screening.
However, satellite retrieval errors at regional scales can reach 10% to 40%. It measures atmospheric column concentration, not mass flow rate at a stack outlet. Therefore, it serves as a tool for “detecting anomalies” rather than replacing CEMS or carbon accounting for auditable inventories.
Laser Sensing & IoT Networks: The Middle Layer for Leak Localization
Between satellites and fixed sensors lie laser techniques (TDLAS, DIAL) and IoT networks. Laser sensing offers ppb-to-ppm sensitivity over hundreds of meters, ideal for detecting valve seal failures or landfill leaks. For instance, a chemical park found peaks of 1,200 ppm methane near pipe racks, equivalent to significant CO2e impacts when annualized.
IoT sensors provide low-cost, high-density coverage. While useful for indoor air quality and alarm assistance, they suffer from long-term drift (0.5%–2% per year) and cross-sensitivity. Without unified calibration, large-scale IoT data may appear “seemingly abundant but actually incomparable.” They are best for process management, not sole regulatory compliance.
Carbon Footprint & LCA: Extending to Supply Chains
Product carbon footprints (ISO 14067/PAS 2050) focus on the entire life cycle. The challenge lies in Scope 3 data. An electronics manufacturer found Scope 3 accounted for 85% of total footprint, with 40% initial data relying on proxies. By establishing supplier platforms, they reduced missing data to 12%.
LCA identifies reduction potential. A building materials firm discovered clinker calcination contributed 60% of its footprint, prioritizing alternative raw materials. However, discrepancies in boundary selection and database updates remain common challenges requiring third-party verification.
Selection Recommendations: Match Technology to Objective
| Objective | Recommended Technology | Key Consideration |
|---|---|---|
| Annual Inventory / Audit | Emission Factor Method | Low barrier; ensure accurate activity data. |
| Regulatory Compliance / Process Opt. | CEMS | High cost; requires strict O&M and calibration. |
| Regional Anomaly Screening | Satellite Remote Sensing | Good for trends; poor for precise attribution. |
| Leak Detection / Fugitive Emissions | Laser / Open-Path | Fast localization; needs inversion models for mass. |
| Facility Safety / Indoor Air | IoT Sensors | Low cost; manage drift and calibration carefully. |
| Product Labels / Trade Compliance | Carbon Footprint / LCA | Depends on supplier data governance. |
Future trends will favor multi-source fusion. High-quality platforms must unify time scales, units, and data quality flags across accounting, CEMS, remote sensing, and IoT. The value of monitoring lies not just in generating reports, but in turning data into actionable management strategies—adjusting combustion parameters, inspecting equipment, or optimizing supply chains.
Competition in this sector is no longer just about sensors and algorithms, but about standards, data governance, cross-system coordination, and credible certification capabilities.