From Technical Challenges to Successful Implementation: A Record of Urban Pipeline Network Project Implementation
Yicai Technology News Summary:
Recently, the district metered area (DMA) project for the water supply network in the old urban area of a prefecture-level city in East China has passed overall acceptance. The project covers an old urban area of approximately 42 square kilometers, serving a population of about 286,000, with a total water supply pipeline length of about 620 kilometers and an average pipe age exceeding 24 years. Before implementation, the area’s annual water supply was about 132 million cubic meters, the non-revenue water (NRW) rate was about 26.4%, the pipeline leakage rate was about 21.7%, and the average annual number of pipe bursts was about 47. After completion, the leakage rate in the project area decreased to about 10.9%, the NRW rate decreased to about 14.6%, annual water savings were about 14.2 million cubic meters, and the minimum night flow decreased from about 2,400 cubic meters/hour before renovation to about 1,280 cubic meters/hour. This case demonstrates that DMA metering is not simply adding more water meters and flowmeters, but rather transforming traditional passive emergency repair-based operations and maintenance into proactive diagnostic management through pipeline leakage control, districting, metering, pressure management, and a closed data loop.
I. Project Background: Pipeline Leakage in the Old Urban Area Has Long Remained at a High Level
The old urban water supply system of this prefecture-level city was formed around the 1990s. With urban population growth, increasing building density, and longer pipeline service life, water supply pipeline leakage gradually became prominent. The project area contains various pipe diameters from DN100 to DN1200 and multiple pipe materials, including grey cast iron pipes, ductile iron pipes, steel pipes, and early plastic pipes. Some pipeline sections are shallowly buried, while others are located beneath old urban roads. Underground utilities are complex, and the distribution of inspection chambers, valve chambers, and metering facilities is uneven.
Before renovation, water supply management in this area mainly relied on manual meter reading, customer reports of faults, emergency repair team inspections, and localized leak sounding. Due to the lack of systematic districting and continuous metering data, leakage management could hardly be localized to specific pipeline sections. Once road flooding, pressure drops, or customer complaints occurred, repair personnel often had to rely on experience to judge the approximate direction and then inspect section by section. This mode could still cope with pipe burst accidents, but lacked stable identification methods for long-term leakage such as hidden leaks, joint leakage, valve leakage, and abnormal customer-side water use.
Before the project started, the water supply company conducted a three-month baseline survey of the area. The survey revealed significant gaps in the old urban pipeline records: about 18% of pipeline sections lacked complete as-built documentation, about 12% of valve chamber locations were inconsistent with GIS records, and about 9% of boundary valves could not be fully closed due to corrosion. Meanwhile, customer-side metering facilities were dispersed, and some large customers still used ordinary mechanical water meters without remote transmission capability. For key indicators such as pipeline leakage rate, NRW rate, and minimum night flow, the existing system could only provide monthly or quarterly estimates and could not support refined decision-making.
Against this background, the DMA metering project was incorporated into the old urban water supply pipeline renewal and leakage control special program. The project goal was not merely to reduce the leakage rate, but to establish a sustainable pipeline leakage management system: through rational districting, large pipeline networks are divided into meterable, analyzable, and assessable management units; through metering facilities, continuous and reliable flow and pressure data are generated; through platform analytics, abnormal areas are identified and work orders are generated; through field investigation and repair, district metering results are verified, ultimately achieving closed-loop management among pipeline leakage, districting, metering, and leakage rate.
II. Technical Challenges: Overlapping Data Gaps, Boundary Interconnections, and Metering Errors
The first step of DMA metering is to determine rational boundaries, but the most prominent difficulty in the old urban area is precisely that pipeline boundaries cannot be fully closed. In the early project stage, technical personnel checked the boundaries of about 7 primary districts and 24 secondary districts and found that bypass flow still existed after some boundary valves were closed, while some areas were affected by flow interference from temporary construction water use, landscaping water use, and fire-test water use. For tertiary districts, about 21 of 86 candidate units had boundary interconnection problems and required valve re-adjustment or the addition of temporary isolation.
The second challenge is metering error. Leakage rate calculation in aging pipeline networks relies heavily on inflow and outflow metering. If the accuracy of master meters, boundary meters, and large-customer meters is insufficient, data deviations directly affect leakage diagnosis. Before renovation, some mechanical water meters had relatively large errors in the low-flow range, especially during the minimum night flow period, when flow was often close to the meter’s starting flow. A conventional propeller-type water meter might under-register low flows; a standard electromagnetic flowmeter might be affected by required straight pipe length and velocity distribution in large-diameter, low-flow conditions. Therefore, the project had to select metering equipment according to pipe diameter, flow range, and installation conditions.
The third challenge is that minimum night flow is affected by non-leakage factors. Nighttime water use in the old urban area is not entirely leakage; hospitals, schools, restaurants, construction sites, landscaping irrigation, and fire-protection systems may all generate nighttime flow. Preliminary data review found that about 14 secondary districts exhibited concentrated nighttime water use. If leakage was judged directly from minimum night flow, false alarms were likely. To address this, the project team introduced customer profiling and historical curve comparison to distinguish fixed nighttime water use, periodic water use, and abnormal flow, thereby reducing the misjudgment rate.
The fourth challenge was construction constraints. Old urban roads are narrow, traffic is dense, and underground utilities are complex; large-scale excavation would affect residents’ travel and commercial operations. The project required minimizing water interruptions and prioritizing methods such as wet tapping, connection under pressure, short-term water interruption, and night construction. Some DN300 to DN800 pipeline sections required boundary flowmeters, but standard straight pipe sections were not available on site. Technical personnel had to use reducers, flow straighteners, or temporary bypass solutions, which also increased installation and commissioning difficulty.
III. Solution: Three-Level DMA Segmentation and Continuous Metering System
To address the above challenges, the project adopted the technical route of "three-level DMA segmentation + continuous metering + pressure monitoring + data platform." Primary districts focused on water plant outlets, trunk networks, and regional dispatch, with 7 primary metering units. Secondary districts focused on street blocks, road systems, and main valve boundaries, with 24 secondary metering units. Tertiary districts focused on small blocks, residential communities, and key pipeline sections, with 86 tertiary metering units. Through this three-level structure, the project divided the 620-kilometer pipeline network into independently observable units, enabling pipeline leakage localization to narrow from broad-area investigation to specific pipeline sections.
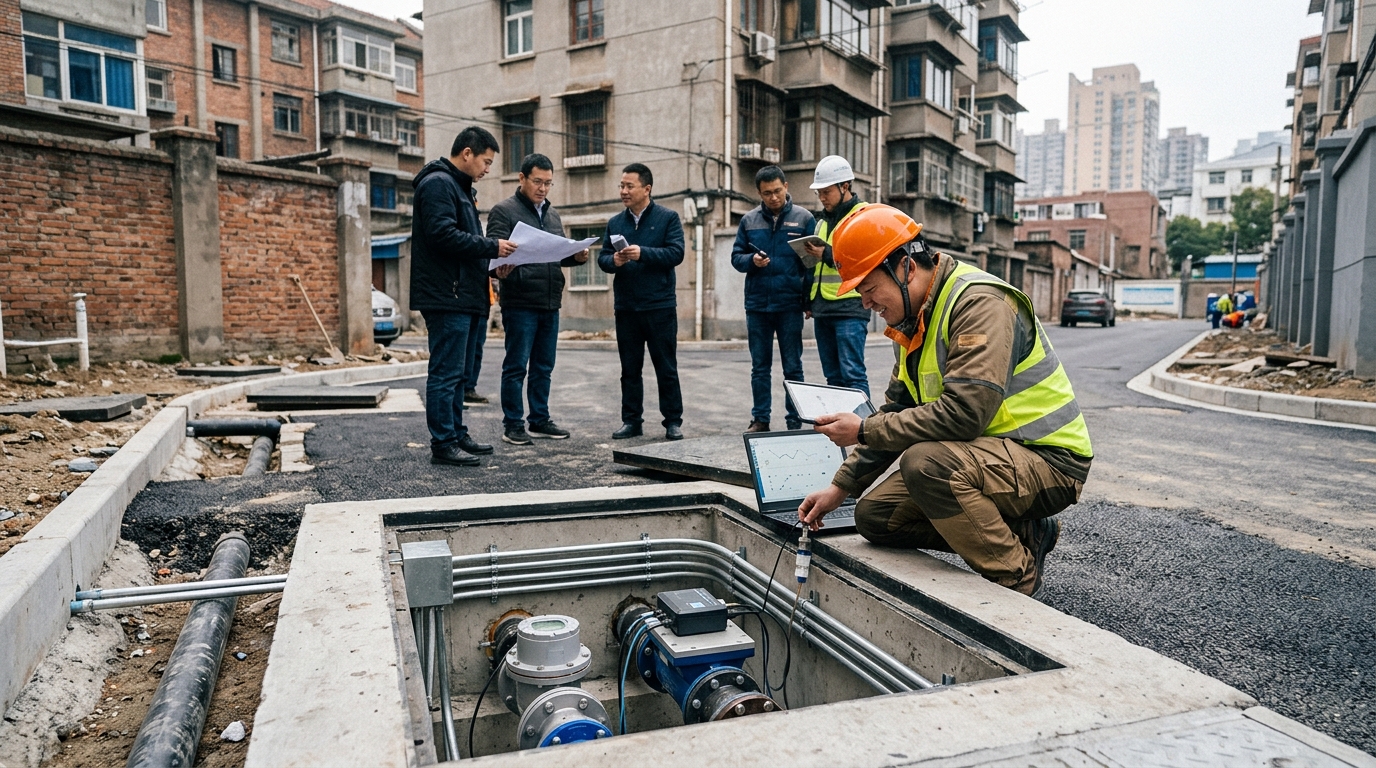
In metering equipment configuration, the project installed about 280 metering devices, including remote transmission electromagnetic flowmeters, ultrasonic water meters, and boundary flowmeters, as well as 36 pressure monitoring points and about 310 sets of data acquisition and communication terminals. For large-diameter boundary metering, high-accuracy electromagnetic flowmeters were preferred, with design accuracy controlled within ±2%. For small- and medium-diameter and customer-side metering, ultrasonic water meters or smart mechanical water meters were selected, balancing low-flow detection and remote transmission requirements. All metering points were assigned unified codes and linked to GIS pipeline sections, valve chambers, pressure points, and emergency repair work orders, forming a correspondence among "equipment—data—space—business."
Minimum Night Flow Analysis
The project set 2:00 to 4:00 a.m. as the main analysis window, calculating the minimum flow, average minimum flow, and abnormal duration for each district. Primary and secondary districts mainly identified broad-area leakage trends, while tertiary districts assisted localization. The system set warning thresholds based on pipe diameter, served population, historical leakage, and pressure level.
Pressure Management Strategy
The original average plant outlet pressure was about 0.42 MPa, and end pressure in some secondary districts exceeded 0.34 MPa. The project installed pressure management valves at 18 key nodes, reducing the average operating pressure in priority areas from about 0.34 MPa to about 0.28 MPa, simultaneously lowering leakage risk and metering instability.
At the platform level, the project deployed a DMA data management and leakage analysis system supporting minute- or hour-level data acquisition, minimum night flow curves, district water balance, abnormal warning, and work order tracking. The platform integrated total water supply, customer water sales, metering error, pressure fluctuations, and leakage rate into the same analytical framework, making "pipeline leakage, districting, metering, and leakage rate" no longer isolated indicators, but traceable, comparable, and assessable management objects.
IV. Implementation Process: 18 Months from Field Verification to Equipment Commissioning
The overall project implementation period was about 18 months, divided into seven phases: baseline survey, district design, equipment installation, platform commissioning, leakage diagnosis, repair verification, and acceptance evaluation.
- Phase 1 - Field Verification: Technical personnel reviewed boundaries of the 620-kilometer pipeline network and inspected about 1,400 valve chambers and potential bypass points. They corrected about 92 valve position deviations, supplemented about 118 missing pipeline records, and closed/replaced 37 ineffective boundary valves.
- Phase 2 - District Design: Combining hydraulic modeling and actual road conditions, the team verified boundaries for primary, secondary, and tertiary districts. Principles included following trunk pipes for boundaries, ensuring metering outlets, and controlling tertiary district population between 2,000 and 5,000. Final coverage reached about 96%.
- Phase 3 - Equipment Installation: Installed 280 metering devices and 36 pressure points using night tapping and connection under pressure techniques. For DN600-DN1000 sections, electromagnetic flowmeters were used; for DN100-DN300, ultrasonic or flange-type flowmeters. Internal scaling in 23 sections was addressed via flow straightening.
- Phase 4 - Platform Commissioning: Two months of data quality governance raised remote transmission success to over 99.2% and anomaly flagging to ~95%. Work orders were linked to district codes for reverse-verification of data reliability.
- Phase 5 - Leakage Diagnosis & Repair: The system generated ~412 suspected anomaly work orders, with ~268 confirmed as valid. Repairs followed a "high-leakage/trunk-first" principle, utilizing leak sounding, correlation localization, and mechanical clamps.
V. Leakage Diagnosis: From "Average Leakage" to "District-Level Localization"
Before implementation, leakage management remained at the average rate level. After completion, the data platform displayed hourly changes in minimum night flow for each district. Taking secondary DMA-08 as an example, covering 2.6 square kilometers and 18 kilometers of DN200-DN800 sections, its minimum night flow fluctuated persistently between 280 and 320 cubic meters/hour, clearly higher than neighboring districts.
Continuous monitoring found DMA-08’s minimum flow repeatedly exceeded 310 cubic meters/hour around 3:00 a.m., with slight pressure declines. After ruling out customer anomalies and bypasses, portable ultrasonic flowmeters confirmed high nighttime inflow. Combined use of correlation leak detectors and electronic leak detectors identified a hidden 4 mm crack on a ductile iron DN300 pipe buried at 2.1 meters. After repair, the district’s minimum night flow dropped from ~318 to ~142 cubic meters/hour.
Another typical unit, tertiary DMA-24, served 3,200 people with DN150-DN300 boundary sections. Its minimum night flow rose from a baseline of ~38 to ~76 cubic meters/hour. Investigation revealed internal leakage in an abandoned fire-protection branch valve and a merchant’s post-meter pipe leak. After repairs, flow recovered to ~41 cubic meters/hour, and the district leakage rate decreased from ~18.5% to ~9.2%.
The value of DMA segmentation is not only in finding individual leaks, but also in identifying systemic problems. After three months, the platform ranked 86 tertiary districts, finding 19 with leakage rates exceeding 15%, concentrated in areas with pipe ages over 30 years and high proportions of grey cast iron. This data allowed the water supply company to shift from road-age-based renewal schedules to a composite score based on leakage, pressure, age, bursts, and complaints.
VI. Repair and Pressure Management: Reducing Leakage Rate and Pipe Burst Risk
During implementation, a total of 163 leak repairs were completed, including 104 hidden leaks, 29 pipe bursts, 22 joint leaks, 8 valve failures, and 40 customer-side issues. Post-repair verification showed total inflow in primary districts decreased by ~9.8%, average minimum night flow in secondary districts decreased by ~46.7%, and anomaly work orders in tertiary districts dropped from a monthly average of 132 to 37.
Pressure management reduced average pressure in priority areas from ~0.34 MPa to ~0.28 MPa via 18 valves. This caused a further ~12% decrease in minimum night flow and a clear reduction in pipe bursts. Statistics showed the average annual number of pipe bursts decreased from 47 to ~18, and average emergency repair time per burst dropped from ~8.6 hours to ~3.2 hours.
Repair methods prioritized small-area excavation and non-water-interruption operations. Mechanical clamps were used for DN100-DN300, while planned windows were used for larger sections. District metering narrowed excavation scopes, avoiding blind digging. The project cumulatively reduced water interruption impact on ~14,000 customer instances.
A re-verification mechanism was established: technicians compared pre/post-repair minimum night flow within 24 hours and re-verified pressure/sales within 7 days. If flow didn't decrease significantly, the system flagged the case as "suspected unclosed loop," triggering a second investigation to resolve issues like misjudged leak points or unresolved boundary cross-flows.
VII. Final Results: Decline in Leakage Rate and Synchronous Improvement of Operational Indicators
Key Performance Improvements
- Pipeline Leakage Rate: Decreased from 21.7% to 10.9%
- NRW Rate: Decreased from 26.4% to 14.6%
- Annual Water Savings: ~14.2 million cubic meters
- Minimum Night Flow: Reduced by ~46.7% (2,400 to 1,280 m³/h)
Operational Efficiency Gains
- Remote Metering Success Rate: >99.2%
- Anomaly Response Time: Shortened from days to <2 hours
- Avg Alert-to-Confirmation Time: Reduced from 48h to 4h
- Customer Complaints (Pressure/Turbidity): Down ~27%
Customer-side experience improved significantly. Water pressure stability increased, and road excavation frequency decreased, reducing impacts on urban traffic and daily life. Economically, with a direct investment of ~38.6 million yuan, annual water production cost savings were estimated at ~29.8 million yuan. Including reductions in electricity, chemicals, and emergency costs, comprehensive annual benefits reach ~32-35 million yuan, resulting in a static payback period of ~3.2 to 3.6 years. More importantly, the project established sustainable leakage management data assets for future planning.
VIII. Outlook: From DMA Metering to Long-Term Smart Water Operations and Maintenance
This case shows that the actual value of DMA metering is not a one-time reduction in leakage rate, but the formation of a long-term pipeline leakage governance mechanism. Future projects need to shift from "building systems" to "using data, cultivating teams, and setting standards." DMA district boundaries require dynamic adjustment as pipelines renew and customers increase. Regular calibration and inspection are essential to prevent leakage rate rebounds due to equipment aging and data drift.
As a next step, the water supply company plans to integrate the DMA system with GIS, hydraulic models, water quality monitoring, and smart patrol inspection. Hydraulic models will optimize pressure valve scheduling; AI will distinguish leakage from temporary water use in night flow curves; and linking water quality monitoring with district metering will help detect secondary contamination risks promptly. Pipeline leakage, districting, metering, and leakage rate can thus be managed through closed-loop operations.

