How a Water Utility Group Achieves Cost Reduction and Efficiency Improvement with Doppler Flow Meters
A case study on implementing non-contact flow monitoring in complex open-channel environments to enhance drainage management, reduce maintenance costs, and improve flood-season dispatch capabilities.
I. Project Background: A Drainage Trunk Canal Requires a Continuous and Reliable Flow Evidence Chain
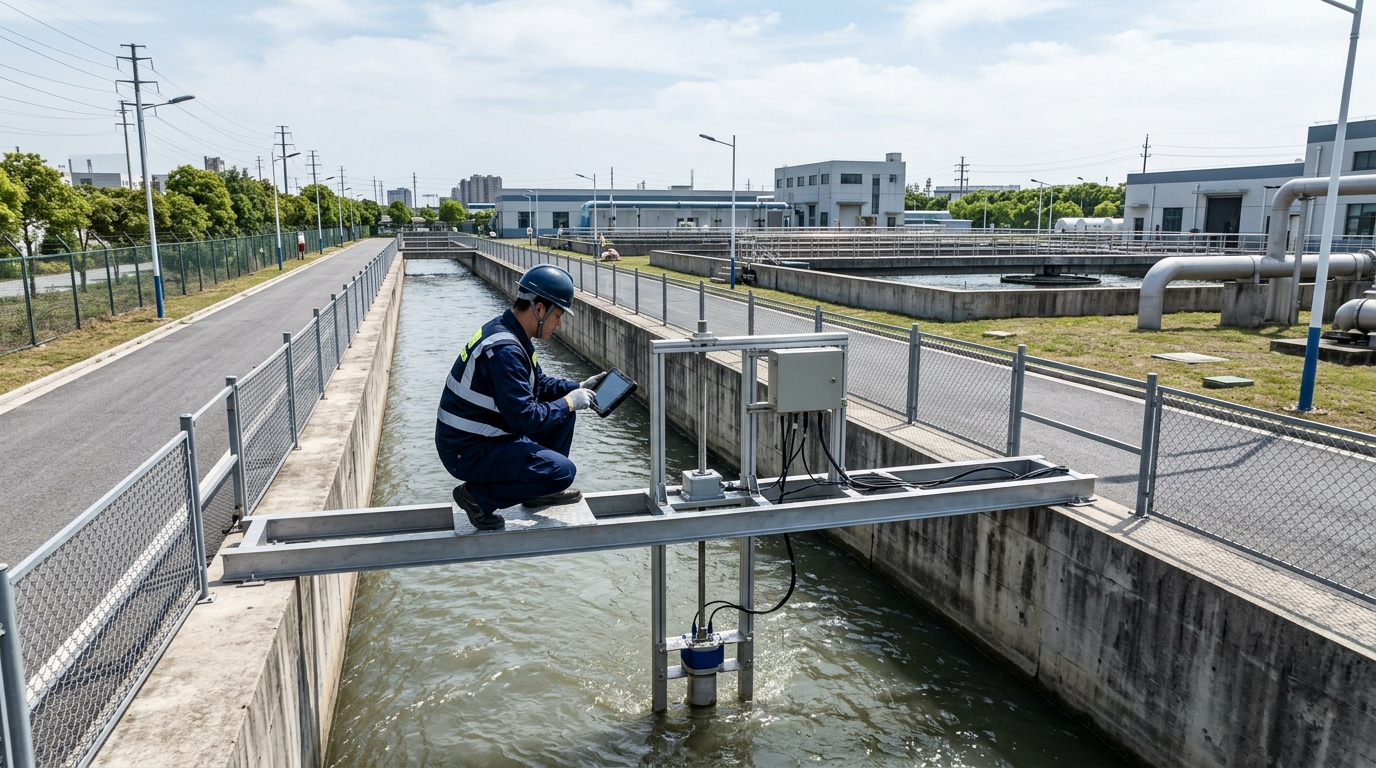
In March 2024, the flow monitoring project for the southern drainage trunk canal of a certain city completed acceptance and entered the continuous trial operation phase. The trunk canal has a total length of approximately 12.6 km and is responsible for stormwater conveyance, combined-sewer interception, and overflow regulation within an approximately 86-square-kilometer catchment in the southern district.
Design Capacity
8.5 m³/s
Daily Sewage Flow
1.2 - 3.6 m³/s
Flood Peak
~9.8 m³/s
Because the route involves urban villages, old residential communities, logistics parks, two lift pumping stations, and the influent of a downstream wastewater treatment plant, management authorities need continuous insight into flow variations for drainage permit supervision, pump station dispatch, overflow pollution warning, and wastewater treatment plant load balancing.
Before the renovation, the trunk canal mainly relied on manual current-meter flow measurement, weir/flume flow meters, and contact electromagnetic flow meters. These methods were prone to probe wear, entanglement, corrosion, and zero drift due to long-term exposure to sewage and debris.
After the 2023 flood season, the owner proposed clear goals: achieve continuous online monitoring of velocity, water level, and flow without interrupting drainage, contacting sewage, or adding extensive civil works. The system needed to synchronously record site conditions through integrated camera footage to provide traceable evidence for overflow events, sedimentation changes, and floating-debris disposal.
II. Technical Challenges: Non-contact Measurement Must Adapt to Complex Open-channel Conditions
Challenge 1: Complex Cross-section Conditions
The primary challenge was the trapezoidal cross-section with a bottom width of ~2.6 m, surface width varying from 3.2 to 6.8 m, and periodic sedimentation of 0.12 to 0.35 m. Field measurements showed normal water levels between 0.35 and 2.15 m, with surface velocities ranging from 0.18 to 2.6 m/s.
- Low Velocity: Small water-surface fluctuations and sparse floating particles result in weak echo signals.
- High Velocity: Strong turbulence leads to unstable target reflection points, challenging velocity capture.
- Prior Errors: Some contact flow meters had errors exceeding 15% after the flood season due to sedimentation and probe obstruction.
Challenge 2: Unstable Surface-to-Average Velocity Conversion
Non-contact Doppler flow meters obtain near-surface velocity, whereas drainage management requires cross-section flow (wetted area × average velocity). In open channels, velocity distribution is affected by depth, roughness, wind waves, and friction. Without proper calibration and cross-section surveying, simply replacing a flow meter does not guarantee stable data.
III. Solution: Build a Multi-source Data System Centered on Non-contact Measurement
The project team adopted a combination solution: "80 GHz non-contact Doppler velocity measurement + radar water-level measurement + integrated camera + edge computing gateway."
Velocity & Level Measurement
- Doppler Device: Installed on under-bridge gantry, ~2.2m vertical distance, 45° incidence angle.
- Radar Level: FMCW transmitter, 0-4m range, ±3mm accuracy.
- Data Output: Modbus TCP to edge gateway at 1 Hz sampling rate.
Visual & Computing Integration
- Camera: 2MP starlight network camera with infrared illumination and H.265 encoding.
- Synchronization: Shared time base with flow/level sensors for event-triggered video.
- Algorithm: Converts radar level to wetted area; calculates flow using calibrated velocity coefficients (0.82–0.88).
IV. Implementation Process: Closed-loop Engineering from Cross-section Survey to Data Calibration
Field Survey & Mapping: The team used RTK equipment to scan three monitoring cross-sections, collecting 398 topographic points. This established curves for water-level vs. surface-width, wetted-area, and wetted-perimeter, serving as base parameters for the flow algorithm.
Installation & Commissioning: Equipment was mounted on an anti-corrosion treated under-bridge gantry with lightning protection and backup power. During commissioning, 259,200 sets of data were collected over 72 hours. Manual comparative measurements using propeller current meters and ADCP were conducted at 18 cross-sections.
Through data replay, the team corrected incidence angles, target areas, and velocity coefficients, ensuring the configuration was ready for daily operations.
V. Final Results: Flow Error Converges, Data Continuity and Dispatch Capability Significantly Improved
Accuracy Improvements
- Avg Relative Flow Error: 3.4%
- Max Flow Error: 5.1%
- Level Error: ±3.2 mm
- Data Completeness: 99.6%
Cost & Safety Benefits
- Maintenance Cycle: Monthly → Quarterly
- Annual Cost Reduction: ~63%
- Confined Space Entry: Reduced Frequency
Flood-Season Validation: On July 18, 2024, the platform monitored flow rising rapidly from 3.8 m³/s to 9.23 m³/s, triggering an alarm in ~28 seconds. Dispatchers adjusted upstream pumps based on real-time data and camera footage. This proactive dispatch reduced overflow volume by ~18,000 m³ compared to historical storms and decreased WWTP influent load fluctuation by ~22%.
VI. Actual Role of Integrated Camera: Making Flow Anomalies Explainable
The integrated camera served as a critical support for data credibility, identifying 124 events of floating debris or blockage. When flow anomalies occurred, operators could retrieve video from 10 minutes before and after the event to distinguish between upstream inflow, pump switching, illegal discharge, or physical blockages.
Images synchronized with flow and water-level data expanded anomaly events from single numerical alarms to comprehensive judgments of "value + footage + time".
The system implemented threshold linkage rules: if water level exceeded 2.0 m while surface velocity remained below 0.25 m/s, it prompted potential debris accumulation. If flow deviated >30% from the historical mean for 5 consecutive minutes, video clips were automatically pushed to the platform.
VII. Outlook: Non-contact Flow Meters Toward Multi-source Fusion and Intelligent Management
This project demonstrates that effective open-channel monitoring requires combining non-contact measurement, velocity conversion, water-level modeling, and visual verification. Future applications will see increased integration of Doppler flow meters with AI recognition and digital twin dispatch models.
For scenarios where sewage cannot be contacted and drainage cannot be interrupted, non-contact solutions offer flexible installation, low maintenance costs, and higher safety. To deliver real value, these systems must emphasize field calibration and data closed loops, ensuring that measurement data can explain field conditions and support operational decisions.