Digital Transformation of Smart Water Management: Data Silos and IoT Platforms
Smart Water Conservancy Enters a “Perception—Cognition—Decision” Closed Loop: Non-Contact Measurement and Integrated Imaging Reshape the Hydrological Monitoring System
Introduction: Smart water conservancy is shifting from the traditional water governance model centered on engineering construction to a modern system driven by data. As tasks such as river/lake chief systems, digital twin basins, and urban waterlogging management advance, hydrological monitoring must establish full-chain sensing capabilities that are explainable, early-warning capable, schedulable, and reviewable. The convergence of non-contact measurement, flow velocity monitoring, water level monitoring, and integrated imaging is becoming the key direction for upgrading the perception layer. Industry observations indicate that over the next three to five years, the competitive focus will shift from “whether it can measure” to “whether it can measure stably, accurately, and at low cost,” and from “whether video is available” to “whether video can support business decisions.”
I. Policy Drivers: The Governance Logic Shift from “Engineering Water Conservancy” to “Digital Water Conservancy”
In recent years, policy guidance has strengthened digitalization, networking, and intelligentization. Keywords such as “smart water conservancy,” “digital twin river basin,” and “smart water network” have appeared with increased frequency in public documents. Related deployments require building forecasting, early warning, simulation, and contingency planning capabilities around scenarios like basin flood control and water resources management. For grassroots departments, this means monitoring systems must not only satisfy “reporting figures,” but also “report accurately,” “report quickly,” and “report comprehensively,” interlinking with scheduling and decision-making systems.
From a governance perspective, the core promoted by policy is not single-equipment procurement but the construction of a business closed loop. Pilot projects for digital twin river basins generally require forming a data foundation, a model platform, and a business application system. The data foundation must include multi-source data such as topography, hydrology, meteorology, engineering, video, and IoT sensing. Water level, flow velocity, rainfall, video, sluice station status, and reservoir operation data are no longer scattered ledgers but should become computable, simulatable, and traceable digital assets. This forces front-end sensing equipment to evolve from manual observation toward automatic acquisition, edge processing, and intelligent recognition.
In mountain flood disaster prevention, policy requirements are pronounced. Grassroots flood-control pressure concentrates on “early warning lead time” and “effectiveness of evacuation.” Traditional manual patrols and isolated gauges struggle to support short-duration heavy rainfall responses. Deploying non-contact measurement and integrated imaging improves continuous monitoring without damaging river ecology or adding substantial civil engineering costs. Future project acceptance will focus on equipment online rate, data completeness, warning response time, and false alarm rate.
The river and lake chief system drives the expansion of monitoring targets to include urban drainage pipe networks, waterlogging points, ecologically sensitive areas, and discharge outlets. Urban governance requires identifying floating debris, illegal dumping, personnel entering water, and abnormal changes. Integrated imaging and AI recognition thus become technical enablers for policy implementation, pushing smart water conservancy from “project-based construction” to “routine operation,” and from “seeing” to “being able to manage effectively.”
II. Market Trends: Monitoring Equipment Moves from Single-Point Collection to Basin-Level Data Assets
Smart water conservancy sits at the intersection of infrastructure digital transformation and governance capability improvement. Industry estimates suggest China’s market has reached tens of billions of yuan, maintaining double-digit growth. While hardware still holds an important share, faster growth comes from video AI, edge computing, digital twins, cloud platforms, data governance, and model subscriptions.
Procurement logic is changing. Early projects focused on “building stations,” emphasizing unit price and basic accuracy. Current projects emphasize “whether data can enter business systems,” including communication protocols, time synchronization, coordinate elevation, cross-section parameters, and fault diagnosis. Integrators must develop solution capabilities covering “sensing—transmission—processing—modeling—application—operation and maintenance.” Long-term value comes from data availability, model credibility, and business response efficiency.
The industry is moving from fragmentation to stratification. The underlying hardware layer includes sensors and gateways; the middle layer includes IoT platforms, video AI, and data governance; the upper application layer includes flood forecasting, waterlogging warnings, and digital twins. Enterprises with data governance and scenario algorithm capabilities will hold greater long-term value. Non-contact measurement and integrated imaging serve as front-end entry points driving back-end growth.
A significant trend is “lightweight deployment.” Traditional stations have long cycles and high costs. Non-contact devices can be rapidly deployed on bridges, culverts, and towers, reducing construction disturbance. Integrated imaging achieves multi-target perception through visible light, infrared, zoom, and AI. The market shifts from “heavy engineering” to “heavy sensing,” expanding coverage from backbone projects to whole-basin, all-scenario monitoring with small nodes, high density, and maintainability.
III. Technology Direction: Non-Contact Measurement Becomes Key to High-Frequency Monitoring
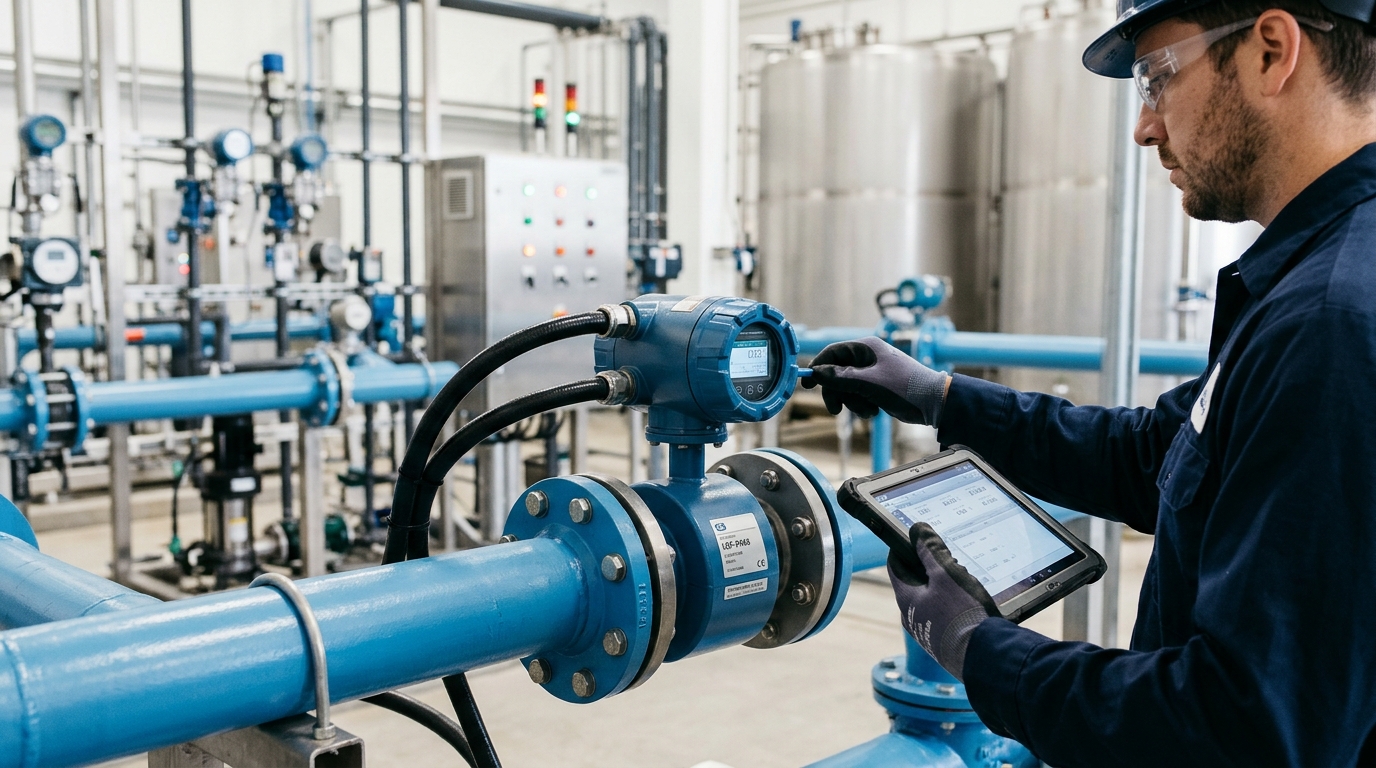
Non-contact measurement—including radar water level, video flow, laser ranging, and acoustic Doppler profiling—reduces direct contact between equipment and water bodies. This lowers failure rates caused by sediment, floating debris, freezing, corrosion, and biological fouling. For small rivers and urban waterways under flood-season conditions, non-contact sensing via aerial or shoreline methods significantly improves continuous operation capability compared to traditional contact-type equipment.
At the parameter level, mature radar devices achieve centimeter-level capability (±1 cm to ±2 cm error, millimeter resolution). Video flow measurement relies on surface texture and algorithms, suitable for wide shallow rivers, with typical velocity errors of 5% to 10%. Integrated imaging provides visual evidence for identifying water surface width, level lines, and sudden events. These technologies complement rather than replace traditional stations; backbone rivers still require high-precision standardized observation, while small rivers and temporary points benefit from rapid non-contact deployment.

The future technical direction expands from single-point water level to comprehensive sensing of “water level—velocity—cross-section—discharge—events.” Equipment will output datasets consumable by models, including water surface lines, velocity fields, and confidence levels. Industry case studies show that retrofitting a southern Chinese river with radar, video flow, and integrated imaging raised 30-day data completeness from below 80% to over 95%, with flood peak identification error within 3 cm. This demonstrates that the value lies in continuously acquiring valid data during floods, which is critical for early warning models.
IV. Integrated Imaging: From “Seeing” to “Understanding” — The Hydrological Visual Hub
Integrated imaging is shifting from “surveillance video” to “hydrological visual sensors.” Previously used for post-event review, video data remained largely unused. With edge computing and model lightweighting, cameras now identify water level scales, floating debris, personnel intrusion, gate opening, icing, and flooding extent in the field, connecting physical water surfaces with digital models.
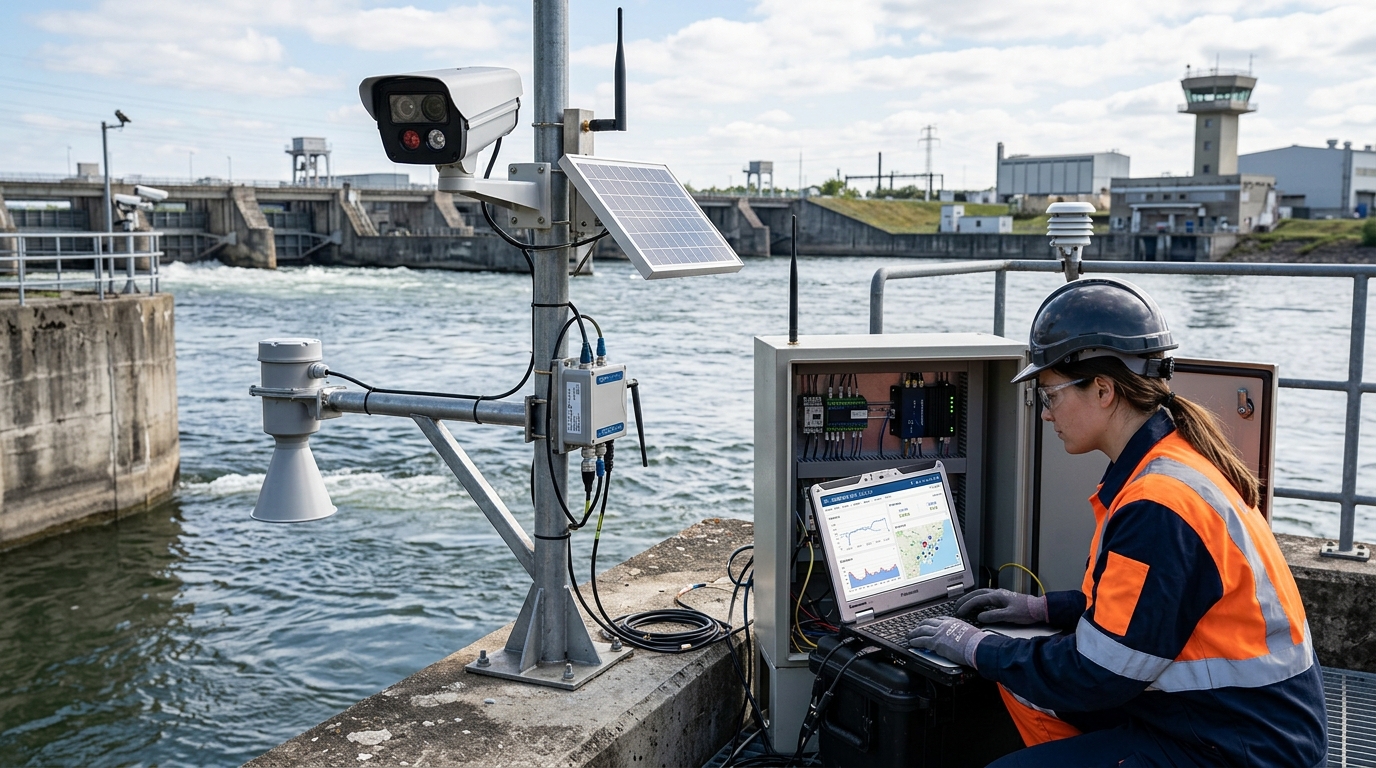
Mainstream solutions evolve from 1080P surveillance to multimodal sensing. Visible-light cameras offer 2 to 8 megapixels or 4K resolution with low-light capabilities. Infrared thermal imaging assists in nighttime identification. Zoom lenses cover hundreds of meters. Field configurations include IP67/68 protection, wipers, defogging, solar power, and 4G/5G/NB-IoT communication. Edge units perform local recognition, controlling response latency within seconds.
The core difficulty is algorithm adaptation due to complex factors like reflection, waves, occlusion, and weather changes. Mature solutions adopt multi-method fusion: radar as primary data, video for cross-validation and anomaly identification; video flow supplements velocity, and image recognition judges surface width and risks. Training requires vast real-scene samples, especially under flood, night, rain-fog, and complex terrain conditions.

In urban waterlogging, integrated imaging is vital. A retrofit project deploying ~40 devices combined with radar and edge AI reduced flooding identification and warning response time from over ten minutes to about 90 seconds. The system links with drainage pumps and traffic screens, forming a “discovery—verification—warning—disposal—review” closed loop. Video becomes a real-time sensing node for urban water safety governance.
V. Fusion of Flow Velocity and Water Level: Multi-Source Sensing Improves Credibility
Water level and flow velocity cannot be viewed in isolation. Water level determines cross-section area; velocity determines volume per unit time. Traditional stage-discharge relationships are unstable in small rivers due to sedimentation and vegetation. Relying solely on water level may overestimate risk; relying solely on single-point velocity fails to represent cross-section discharge.
Multi-source fusion is the key path. Radar provides continuous elevation; video flow provides velocity distribution; rainfall provides runoff input; integrated imaging provides event evidence; gate/pump status provides boundary conditions. Different sources require spatiotemporal alignment and quality evaluation. When errors are controlled (level ±1-2 cm, velocity ±0.1 m/s), discharge errors constrain to 5-10%. However, under adverse conditions, multi-source cross-validation is essential to mitigate increasing errors.
The value of fusion lies in improving warning credibility. False alarms cause fatigue; missing data leads to missed warnings. Integrated imaging acts as an “evidence chain,” making early warning explainable, verifiable, and traceable.
Cases show that after a provincial reservoir group connected water level, velocity, rainfall, video, and gate data, the false alarm rate decreased by ~40%, and verification time shortened from 20 minutes to under 3 minutes. The key was establishing data correlation rules: water level changes must be jointly verified with upstream rainfall, reservoir area, gate opening, downstream velocity, and video. Multi-source fusion moves smart water conservancy from “monitoring” to “diagnosis.”
VI. Application Scenarios: Differentiated Needs Across Domains
Mountain Flood Disaster Prevention
Emphasizes “speed”. Focuses on rapid water level rise, sudden velocity increases, and debris flows in small basins. Poor communication and unstable power require low-power, maintenance-free, edge-computing devices. Objective: Warnings within 3-10 minutes, securing 30-60 minute evacuation lead times. Imaging confirms road blockages and stranded personnel.
Urban Waterlogging Governance
Emphasizes “accuracy” and “coordination”. Requires high-density sensing in pipes, pump stations, and underpasses. Video identifies flooding extent and vehicle/pedestrian risks. Equipment must be compact and concealed due to limited space. Systems upgrade from “drainage coordination” to “multi-source sensing coordination.”
Irrigation Districts & Agricultural Water Saving
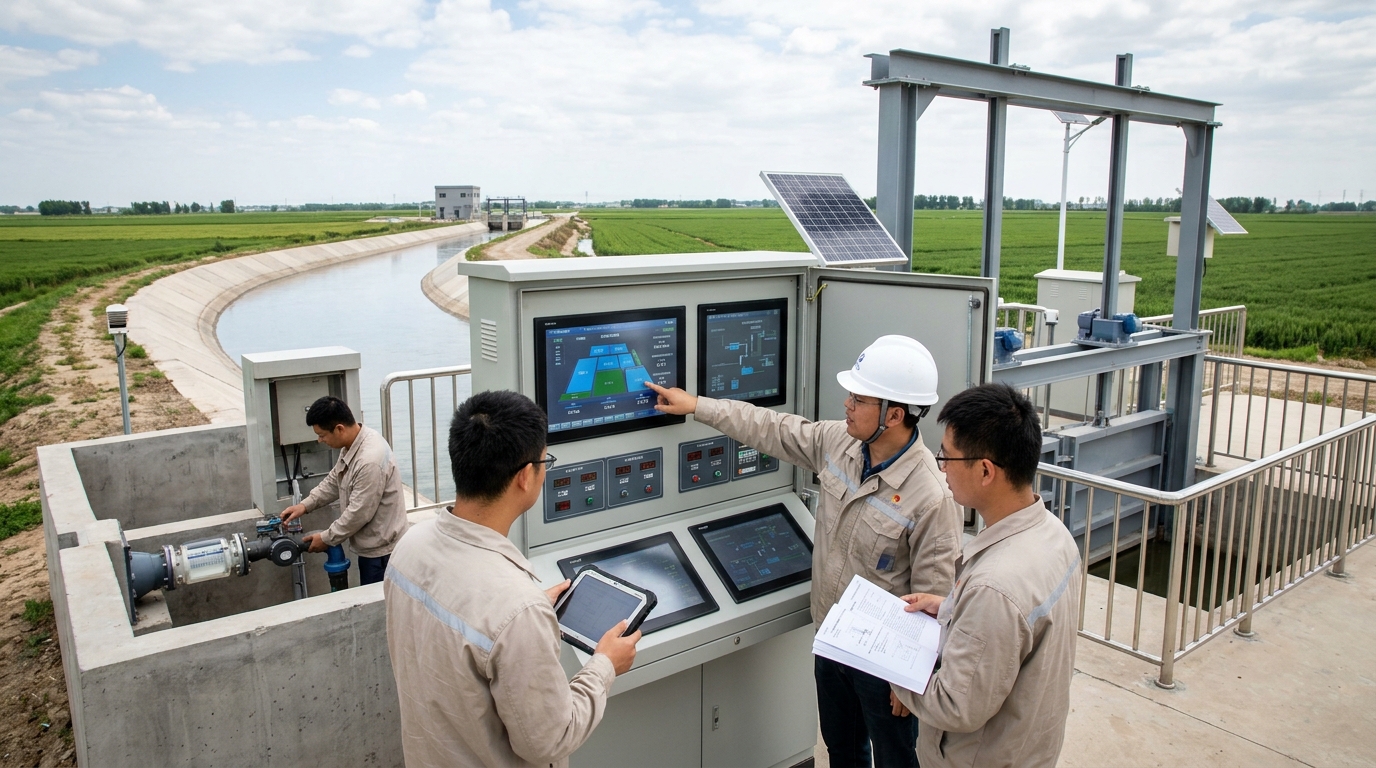
Emphasizes “controllability” and “measurability”. Addresses coarse allocation and experience-based scheduling. Monitoring calculates canal discharge; imaging identifies sedimentation and illegal withdrawal. A large district case showed efficiency rising from 55% to 62%, saving millions of cubic meters annually.
River and Lake Management & Ecology
Emphasizes “long-term change” and “event identification”. Patrols for encroachment, sand mining, and pollution. Forms a closed loop of “hydrological data + visual evidence.” Future mode shifts to “AI preliminary screening, manual review, law enforcement disposal,” making density and algorithm accuracy key indicators.
VII. Risks and Bottlenecks: Quality, Standards, and O&M Determine Success
The primary risk is unstable long-term operating quality. Devices often perform well at acceptance but decline during floods, winter, or lightning strikes. If online rate falls below 85%, forecast errors increase significantly; if completeness falls below 90%, dispatcher trust declines. Even non-contact devices require regular cleaning, calibration, and occlusion checks. Project success depends on O&M mechanisms, not just procurement.
Standards unification is a bottleneck. Differences in data formats, timestamps, coordinates, and protocols across vendors hinder digital twin models, leading to “multiple inconsistent water levels.” The industry needs unified standards for station codes, geometry, time sync, quality labels, and interfaces. Clearer standards enable stronger reuse across basins and platforms.
Algorithm false alarms and responsibility boundaries matter. Recognition cannot be 100% accurate under difficult conditions. High false alarm rates cause “boy who cried wolf” effects; loose thresholds miss risks. Scenario grading and confidence mechanisms are needed: auto-warn high-confidence, manually review medium, record low-confidence events. Competition balances false alarm cost, missed alarm cost, and response efficiency.
Cybersecurity and data sovereignty are critical. Leaks or tampering affect flood control command. Device authentication, transmission encryption, permission grading, and log auditing are required. Front-end sensing systems must be isolated from production control zones. Projects lacking security systems cannot enter core dispatching businesses.
VIII. Outlook: Digital Twins, AI Agents, and Space-Air-Ground Networks
Over the next 3-5 years, smart water conservancy moves from “device networking” to “data intelligence.” Non-contact measurement and imaging become components of the digital twin sensing foundation. Digital twins map real rivers and operations into computable models, forming a closed loop of sensing, modeling, dispatching, and feedback. Evaluation focuses on whether data supports models, models support decisions, and decisions improve outcomes.
AI will evolve into “water conservancy intelligent agents.” Beyond recognition, agents will handle data quality diagnosis, anomaly detection, nowcasting, scheduling recommendations, and emergency reviews. For example, upon detecting rising water and debris, an agent can judge risk type, generate schedules, push verification tasks, and record processes. AI automates repetitive monitoring, allowing humans to focus on judgment and field disposal.

Space-air-ground integrated sensing will emerge. Ground devices form near-ground sensing; drones provide aerial supplementation; satellites offer macro perspectives. Future networks will hierarchically structure “high-precision backbone stations, lightweight small rivers, dense urban points, and remote-sensing lakes.” Non-contact and imaging assume roles as high-frequency, low-disturbance, expandable nodes.
Business models shift from equipment sales to “data services + O&M subscription + model optimization.” Users pay for continuously available data, explainable warnings, and assessable response times. Hardware parameters (power, anti-interference, accuracy) still need improvement, but platform vendors’ core barriers will be data governance, model explainability, and cross-system coordination. The industry enters a stage of “long-term operation.”
Overall, the market space continues to expand, but growth logic shifts from extensive construction to refined governance. The convergence of non-contact measurement, velocity, water level, and integrated imaging drives hydrological sensing from single-value collection to multi-source evidence generation.