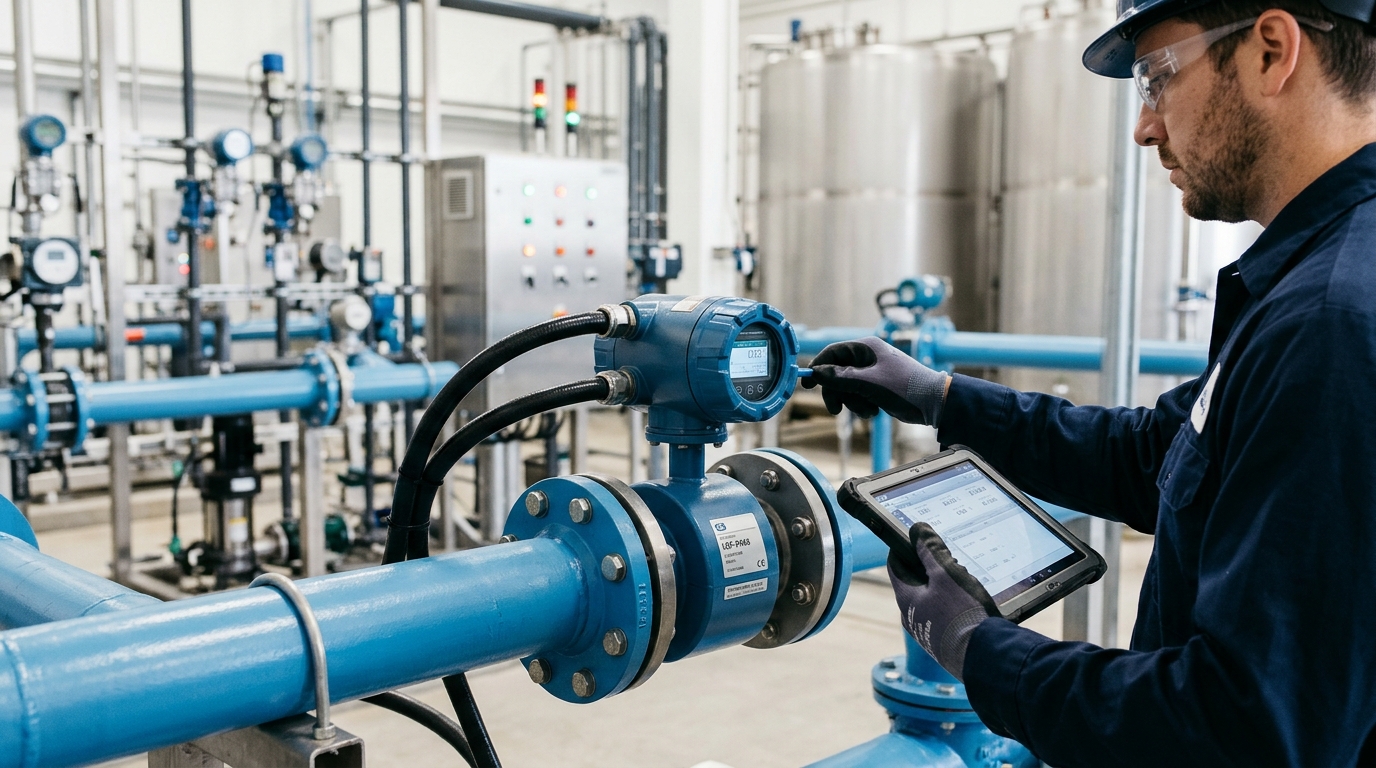
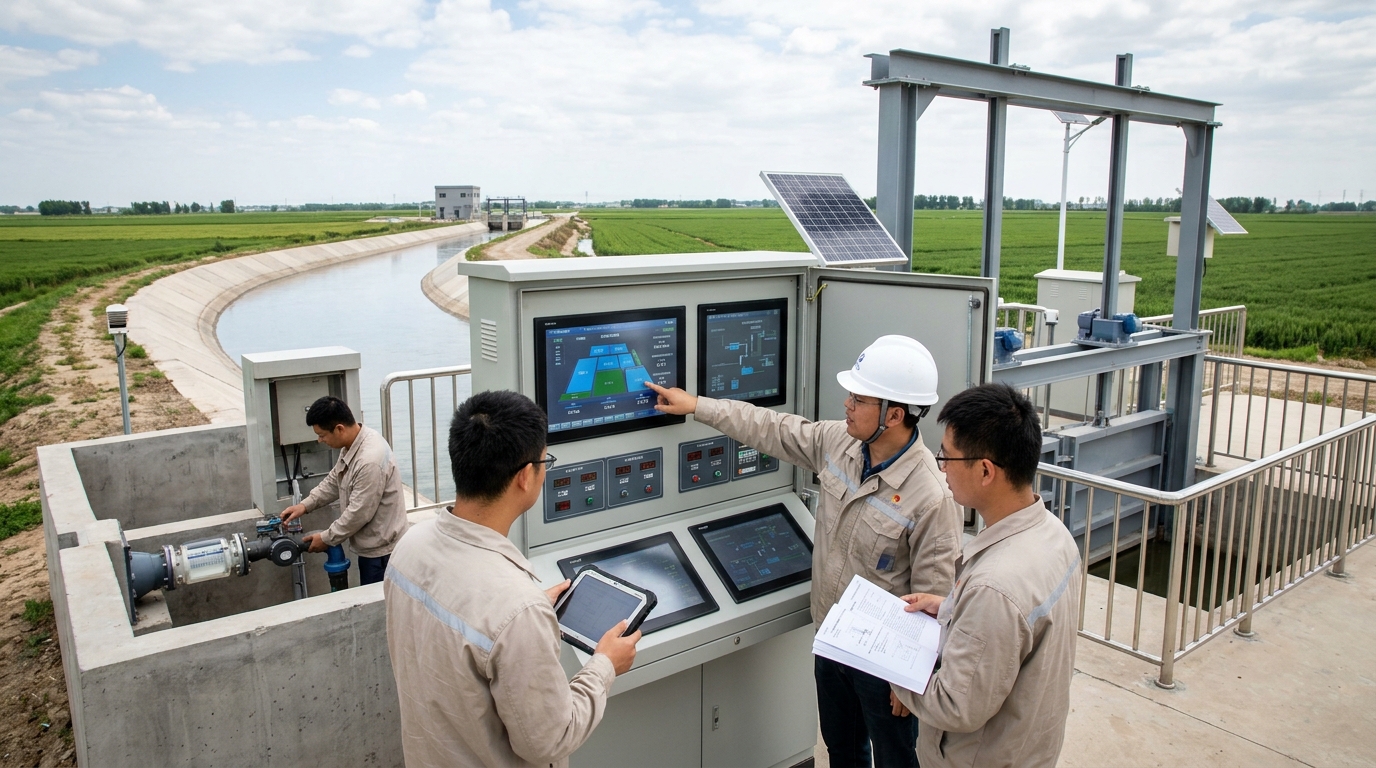
Smart Water Management Digital Transformation: Data Silos and IoT Platforms
Yicai Technology News Editorial | Industry Observation
Smart Water Conservancy Industry Insight: Non-Contact Measurement and Integrated Cameras Reshape Water Level and Flow Velocity Perception
Over the past decade, China's water conservancy informatization has completed the leap from “whether it exists” to “whether it is connected”; the focus of the next phase is to turn data on water level, flow velocity, rainfall, infrastructure status, and other elements into predictable, dispatchable, and reviewable business assets. With the advancement of tasks such as the National Water Network, digital twin river basins, the River and Lake Chief System, and urban drainage and flood prevention, smart water conservancy is no longer just large-screen visualization, but a systems engineering effort centered on non-contact measurement, video perception, data models, and operations and maintenance closed loops. For the industry, what truly determines project effectiveness is often not whether the platform interface is eye-catching, but whether front-end sensing is stable, whether cross-section data is trustworthy, whether event recognition is accurate, and whether dispatching recommendations can be implemented.
I. Policy Guidance and Demand Upgrade: Smart Water Conservancy Enters the “Data Governance” Phase
From a policy perspective, the “14th Five-Year Plan” smart water conservancy construction plan, pilot programs for digital twin river basins, and related deployments for the National Water Network are moving water conservancy informatization from department-level systems to basin-level coordination. Public policy texts generally emphasize “data foundation, model platform, knowledge platform” and “forecasting, early warning, pre-emptive simulation, and contingency planning” capabilities. This means project acceptance no longer looks only at device online rate, but also at whether data can support models and whether models can serve dispatching. Since 2023, local water conservancy, housing and construction, and ecological environment departments have continued investment in scenarios such as small and medium rivers, urban inland rivers, reservoirs, and irrigation districts, with the focus shifting from single-point monitoring to regional coordinated governance.
Changes on the demand side are equally evident. Traditional manual measurement and reporting can hardly meet high-frequency, real-time, and safety requirements. Nighttime patrol measurements during flood seasons are high-risk; urban drainage and flood prevention require minute-level response; rigid constraints on water resources require more trustworthy abstraction, discharge, and cross-section flow data. The increased adoption of non-contact measurement and integrated cameras is not because the technology is “trendy,” but because it reduces operations and maintenance costs, improves data continuity, and reduces the probability of personnel entering hazardous cross-sections or working at night. For widely dispersed monitoring stations, device combinations requiring less maintenance and enabling remote diagnosis are more likely to achieve large-scale deployment.
Investment structures are also changing. Early projects were hardware-dominated... mature projects pay more attention to algorithms, data governance, model services, and operations and maintenance. Budget breakdowns show front-end sensing ~40–50%, platform/data governance ~30%, and model/O&M services ~20–30%.
This structure indicates that the industry is shifting from “buying equipment” to “buying capabilities,” and from “delivery upon completion” to “long-term operational value.”
II. Non-Contact Measurement Becomes Mainstream Field Sensing: From “Measurable” to “Long-Term Stable Measurement”
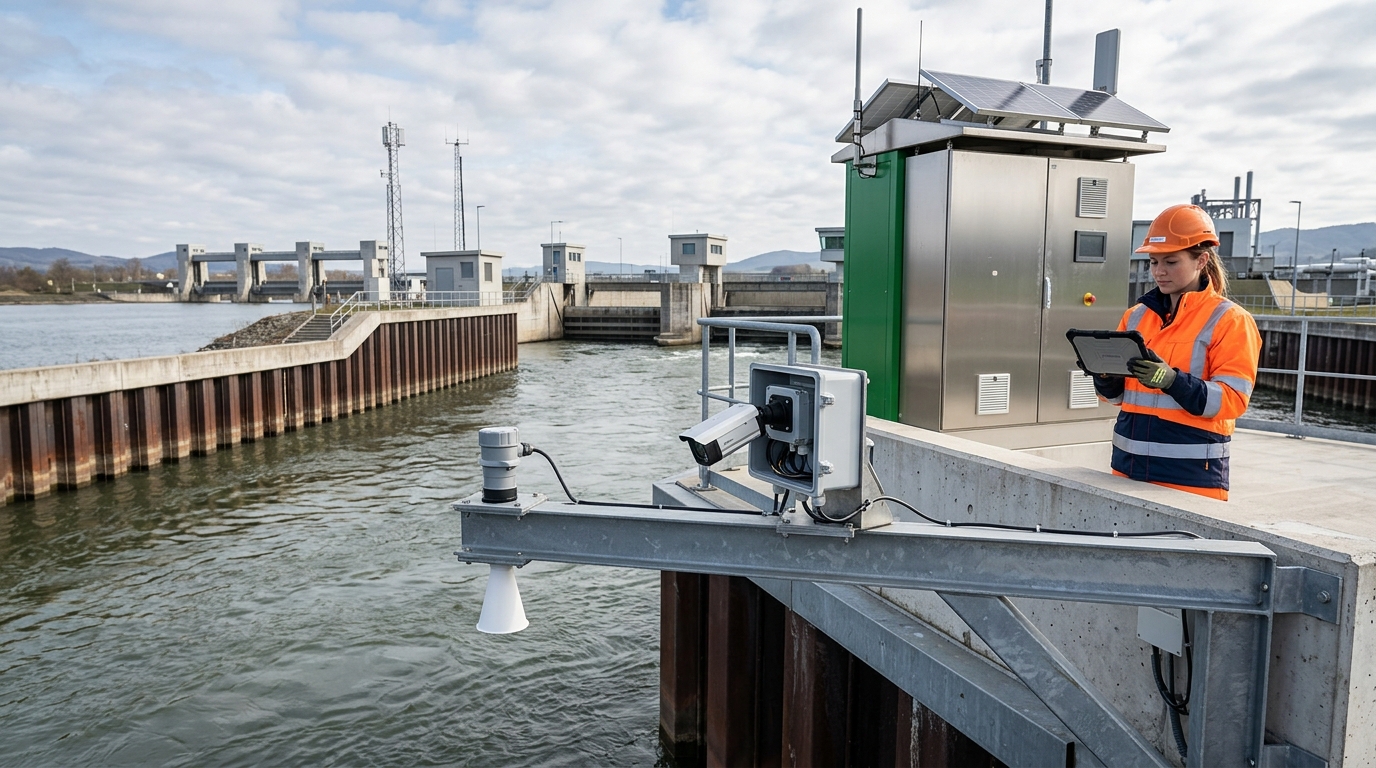
Non-contact measurement is becoming the mainstream path for field sensing in water conservancy. Taking water level as an example, an 80 GHz radar level gauge can achieve accuracy of about ±1 cm, resolution of 1 mm, and a measuring range of about 0.3–30 m in typical river channel and reservoir scenarios, with a sampling interval settable to 1 minute. Compared with float-type and pressure-type sensors, radar level gauges do not contact the water body, reducing clogging, corrosion, and manual calibration frequency. They are more suitable for flood-season environments with high sediment content, abundant floating debris, and rapid water-level fluctuations. Video water-level recognition can also serve as an auxiliary verification method, using image algorithms to read staff gauges or water-surface lines and cross-validate radar data.
In flow velocity measurement, non-contact paths are also developing rapidly. Methods such as image particle velocimetry, video-based flow measurement, and radar surface velocity can obtain surface velocity without contacting the water body, with typical ranges covering 0.05–5 m/s. Accuracy is affected by water-surface texture, lighting, wind waves, and floating debris, typically within ±5%–±10%. Combining radar water level, integrated cameras, and cross-section models can form a “water level–area–velocity–discharge” data chain. Compared with single-point flowmeters, this approach is easier to deploy in wide-area river networks and complex cross-sections, and is more suitable for urban inland rivers and small and medium rivers.
However, non-contact measurement is not “plug and play.” Project acceptance must focus on long-term stable data rather than laboratory indicators. Wind waves, rain and snow, low nighttime illumination, water-surface reflection, algae, sediment, and floating debris all affect data quality. Data from an urban inland river monitoring station operating for six months showed that the valid data rate improved from 82% in the initial period to 95%. Key improvements included cross-section obstruction clearance, camera installation angle optimization, radar gain adjustment, and edge algorithm threshold correction. The industry needs to establish more refined scenario libraries and evaluation methods, avoiding the use of a single parameter to measure all waters.
III. Velocity and Water Level Synergy: From Single-Point Readings to Cross-Section Flow Estimation
Synergy between water level and flow velocity is the key to smart water conservancy moving from “seeing water” to “understanding water.” A single-point water level can only indicate whether the water is “high,” not how much water is coming. Flow estimation requires cross-section geometry, stage-area curves, velocity distribution, and roughness coefficients. Non-contact velocity typically measures surface velocity, then obtains discharge through empirical coefficients, hydrodynamic models, or cross-section average velocity conversion. Errors are related to cross-section shape, wind field, bed friction, aquatic vegetation flow resistance, and riverbed evolution. Therefore, water level and velocity are not isolated readings, but multidimensional expressions of the same hydrological event.
Case Study: Provincial Small and Medium River Flood-Control Cross-Section
The project deployed radar level gauges, integrated cameras, and edge flow measurement algorithms, and built a cross-section model based on historical manual flow measurements. After a period of operation, flow estimation error converged from the 15%–20% fluctuations caused by sparse manual measurement and reporting to 8%–12%. As a result, dispatching departments can more accurately judge flood peak arrival time, cross-section conveyance capacity, and risk of exceeding warning levels, reducing “waiting for water based on experience.” This change shows that the value of non-contact measurement lies not in replacing manual work, but in improving the continuity and computability of cross-section data.
In terms of technology trends, future sensing will expand from “points” to “cross-sections,” and then to “river reaches.” Single-point water level and surface velocity will gradually be fused with multi-point video, radar arrays, drone inspection, satellite remote sensing, and underwater sonar to identify water-surface lines, flow area, floating debris flow-obstruction effects, and riverbed evolution. With improved cross-section ledgers and model libraries, water level, velocity, and discharge can automatically generate confidence intervals rather than single values. Dispatching systems need to simultaneously display values, error sources, and confidence levels to help business personnel understand data boundaries.
IV. Upgraded Role of Integrated Cameras: From Video Surveillance to Visual Perception Entry Point
The role of integrated cameras in smart water conservancy is also upgrading. Previously, cameras mainly carried video surveillance; now they are becoming visual perception entry points. Visible-light, infrared, night-vision, zoom, wide-angle, and low-light cameras can be deployed in combination. After 1080P or 4K video is compressed via H.265, and combined with edge AI processing, events can be recognized without continuously uploading high-bit-rate streams. Typical recognition targets include water-surface anomalies, floating debris accumulation, personnel intrusion, sluice gate status, overflow, levee seepage, water-level staff gauge readings, and vessel trajectories. Video is no longer merely about “seeing,” but about “discovering actionable events.”
- Recognition Accuracy: In controlled scenarios, water-level staff gauge recognition error can be controlled at ±2–3 cm.
- Debris Detection: Floating debris accumulation recognition accuracy can reach 80%–90% under sufficient training.
- Bandwidth Optimization: Edge devices upload only event clips and structured data, reducing video bit rate to 2–4 Mbps.
- Storage Strategy: Local storage buffers of 7–30 days support resume transfer after network outage and post-event review.
A reservoir dam safety monitoring project linked integrated cameras with water level and seepage pressure data. Video algorithms detected abnormal floating debris accumulation on the reservoir surface and automatically issued alarms, transforming patrol personnel from passively reviewing recordings to receiving event clues, with response time shortened from hours to under 10 minutes. Project review showed that the true value lies in the closed loop of “event–location–time–response outcome,” not simply in increasing the number of cameras. In the future, integrated cameras will be deeply coupled with non-contact measurement and become a visual validation layer for the credibility of water level and flow velocity data.
V. Digital Twin and the “Four Pre” Functions: Data Closed Loop Determines the Quality of Smart Water Conservancy
The core of digital twin water conservancy is not 3D visualization, but trusted data entering models. Water level, flow velocity, rainfall, and infrastructure status must be associated with the same basin coordinate system, elevation datum, cross-section ledger, and equipment ledger. If data governance is insufficient, the larger the platform, the easier it becomes distorted. Inconsistent elevation datum at one cross-section may cause false judgments of water-level warning exceedance; an opaque discharge conversion coefficient may cause bias in the dispatching model; a video event without geolocation coding may not enter the contingency workflow. Data governance is becoming the threshold for smart water conservancy moving from “visible” to “usable.”
The “Four Pre” functions impose higher requirements on the data closed loop. Forecasting relies on rainfall, runoff generation and concentration, and channel routing models; early warning relies on water-level warning exceedance, velocity anomalies, and video events; pre-emptive simulation relies on sluice gate, pump station, flood detention basin, and pipe network dispatching simulations; contingency planning relies on affected population, materials, roads, and emergency rescue forces. A city drainage and flood prevention project integrated video water level, pipe network liquid level, and pump station status into models, resulting in urban waterlogging early warning 10–30 minutes in advance and pump station dispatching shifting from manual experience to system-recommended instructions. Although model accuracy is still constrained by rainfall forecasting and pipe network data, operational response time has been significantly shortened.
The key to the closed loop lies in feedback. After an event is triggered, the system needs to record time, location, responders, response outcomes, and review conclusions, which are used to train algorithms, correct models, and optimize thresholds.
In the future, digital twin water conservancy will move from “visualization platforms” to “decision operating systems,” with higher requirements for data quality, model explainability, and permission management. The industry needs to avoid interpreting digital twin as a large-screen project, and should focus on whether data can enter dispatching, whether dispatching results can be written back, and whether written-back data can improve the next prediction.
VI. Market Trends and Business Models: From Equipment Procurement to Long-Term Operational Value
Competitive Landscape
Participants include design institutes, integrators, vendors, software providers, operators, and research institutions. Focus shifts from price to delivery capability, O&M capability, and data asset accumulation.
Client Priorities
Government: Acceptance indicators, data compliance, cybersecurity.
Operators: Valid data rate, false alarm rate, response time, cost savings.
Growth scenarios remain concentrated in small and medium river management, urban drainage and flood prevention, reservoir hazard elimination, irrigation district modernization, aquatic ecological restoration, and River and Lake Chief System supervision. Non-contact measurement and integrated cameras are suitable for widely dispersed stations and can reduce manual patrol frequency. After an integrated monitoring station was deployed in a regional river chief project, manual river patrol frequency decreased by about 30%–50%, and problem discovery rates improved, especially for nighttime illegal discharge, floating debris accumulation, and water-surface anomalies, which became more deterrent. Such projects show that the value of technology investment is reflected not only in flood control, but also in daily supervision and ecological governance.
Business models are also changing. One-time construction is gradually evolving into “equipment + platform + algorithms + operations and maintenance” subscription services. Some projects have begun to be assessed based on data quality, event accuracy, response time, and operations and maintenance availability. Standardized evaluation will drive higher industry concentration, and low-end projects that compete on parameters and neglect operations and maintenance will face elimination. In the future, water conservancy sensing devices must not only provide data interfaces, but also auditable data quality reports; platforms must not only display results, but also record data sources, algorithm versions, and response closed loops.
VII. Technical Challenges and Forward-Looking Directions: Multi-Source Fusion, Edge Intelligence, and Autonomous Inspection
Technical challenges remain complex. Robustness in complex scenarios is the primary issue. Mountain river channels, urban inland rivers, tidal reaches, high-sediment flows, algal coverage, and highly reflective water surfaces differ greatly; a single algorithm cannot cover all cases. Low power consumption, communication coverage, edge computing capability, and algorithm generalization also constrain large-scale deployment. Remote stations require solar power, BeiDou short-message, or LEO satellite communication; urban stations require 5G and edge computing. The industry should establish more refined scenario test sets, including nighttime, rainstorms, strong winds, floating debris, low illumination, occlusion, and sensor drift conditions.
Security and compliance are equally critical. Video involves privacy, cross-domain data transfer, and cybersecurity; devices need to support encrypted transmission, access control, resume transfer after network outage, log auditing, and secure updates. Requirements for water conservancy critical information infrastructure are rising, with supply chain security, domestic technology compatibility, and algorithm explainability becoming procurement concerns. If integrated cameras only emphasize recognition capability while neglecting data compliance, projects may be difficult to scale. In the future, the industry needs to establish standards between event recognition and privacy protection, such as face-area anonymization, tiered video storage, least-privilege access, and operation traceability.
Looking ahead, multi-source fusion and large models will change water conservancy sensing. Radar, video, drones, underwater sonar, meteorological radar, satellite remote sensing, and IoT sensors will form complements rather than replace one another. Vision-language models can automatically generate event descriptions, helping dispatchers understand “what happened on the water surface”; time-series models can detect anomalous trends in water level and flow velocity; autonomous inspection robots can enter hazardous cross-sections or reservoir areas. LEO satellites, BeiDou short-message, and edge computing will cover remote stations, enabling non-contact measurement to move from locally usable to fully operable across all regions.
VIII. Closing Outlook: Make Every Data Point Trustworthy and Bring Every Event to a Closed Loop
Over the next 3–5 years, smart water conservancy will enter the “trusted sensing + intelligent decision-making” phase. Basic data such as water level, flow velocity, and rainfall need to reach a level that is auditable, traceable, and usable for models. Non-contact measurement will become standard equipment, integrated cameras will become the event entry point, and edge computing will become a node for data filtering and preliminary cognition. Industry attention will shift from “whether devices exist” to “whether data is continuous, whether errors are controllable, whether events are actionable, and whether models are explainable.” This requires equipment vendors, platform providers, and operations and maintenance parties to jointly establish long-term service standards.
Competition will no longer be judged solely by equipment parameters, but by scenario understanding capability. Whether a cross-section is stable, whether an event can be accurately recognized, and whether a dispatching action can respond at the minute level are where value lies. Policy, technology, and markets are jointly driving water conservancy from experience-based management to data-driven operation. For urban waterlogging, minute-level data determines pump and gate dispatching; for small and medium rivers, cross-section flow determines warning lead time; for reservoir dams, video events and seepage pressure data determine risk response speed; for water resources management, flow credibility determines abstraction and discharge regulation.
For participating organizations, emphasis should be placed on standards, data governance, algorithm evaluation, and operations and maintenance closed loops, avoiding turning smart water conservancy construction into a “large-screen project.” Only when non-contact measurement, flow velocity, water level, and integrated cameras truly enter the business chain can the water conservancy sensing system support safer flood-control dispatching, more refined water resources management, and more sustainable aquatic ecological governance. The key for the industry's next step is not to stack more sensors, but to make every data point trustworthy, bring every event to a closed loop, and make every dispatching action reviewable.