Return on Investment Analysis of Doppler Flowmeters: Cost-Benefit Comparison in Smart Water Management Projects
Market Trends, Procurement Strategy, and Lifecycle Cost Analysis
Introduction: Evolution to Comprehensive Monitoring
Against the backdrop of expanding applications in smart water management, urban drainage, flood prevention, irrigation district measurement, riverine ecological flow monitoring, and industrial stormwater outfall management, Doppler flowmeters are evolving from standalone flow acquisition devices into comprehensive monitoring terminals. These modern systems integrate flow velocity, water level, non-contact measurement, data communication, and visual verification.
Unlike the early stage focused solely on 'whether it can measure', current industry procurement focuses more on 'whether the measurement is stable, whether the data is traceable, and whether O&M is controllable'. This shift indicates that the market is transitioning from hardware parameter competition to competition in engineering adaptability, data quality, and total lifecycle cost.
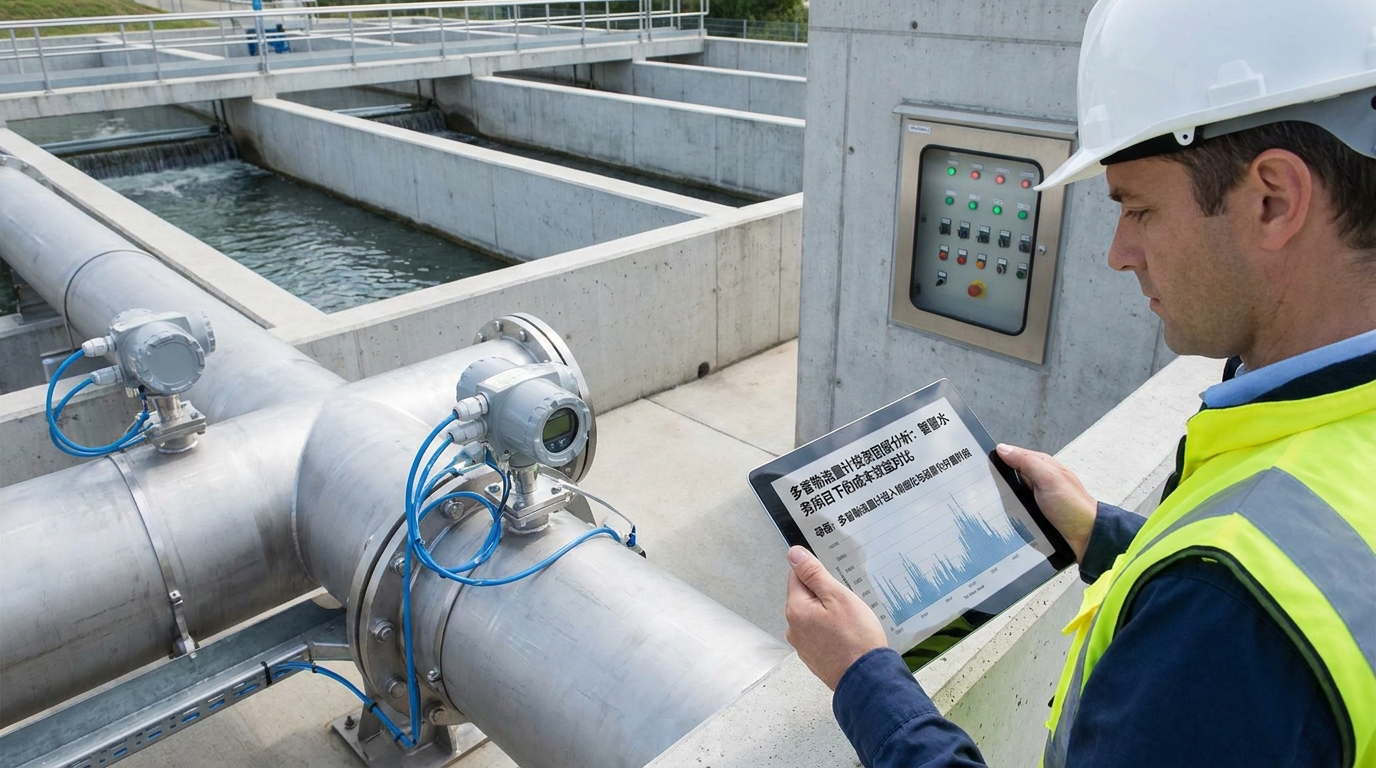
Key Market Shift
- From: Single-point flow velocity acquisition.
- To: Integrated terminal (Flow + Level + Visuals).
- Focus: Data traceability & O&M controllability.
Technically, Doppler flowmeters measure fluid velocity based on the Doppler effect—calculating speed when waves encounter moving water bodies or suspended particles. In practice, contact devices are used for full-pipe or partially-full scenarios, while non-contact devices are preferred for sewage, corrosive water, debris-heavy outfalls, and hard-to-access box culverts.
"The accuracy of water level measurement, the stability of the level gauge, and the accuracy of the cross-sectional model often determine the credibility of the final flow data."
It is worth noting the increasing importance of the water level parameter. Flow rate is not just velocity; it is the product of velocity and wetted cross-sectional area. Consequently, many modern devices now integrate flow velocity, water level, temperature compensation, attitude monitoring, and even cameras for floating debris identification and overflow judgment.
Market Landscape: Integration of Velocity, Level, and Vision
Market demand stems primarily from four scenario types:
- Urban Drainage & Flood Monitoring: High need for non-contact measurement and rapid response to rainfall.
- Irrigation Districts: Focus on low-flow stability and long-term power supply.
- River/Lake Ecology: Emphasis on data continuity and remote transmission.
- Industrial Outfalls: Corrosive environments requiring evidence collection.
The market products fall into three categories:
- Contact Doppler Flowmeters: Submerged sensors suitable for stable water quality. Best for low-flow velocity response in pipelines.
- Non-Contact Surface Devices: Radar/microwave technology measuring surface velocity. Ideal for sewage, sediment-laden water, and difficult maintenance sites.
- Integrated Monitoring Stations: Combine velocity, level, camera, lighting, and comms into a visual unit.
The integration of cameras transforms these devices from mere 'data collectors' into 'on-site evidence providers'. For instance, if flow velocity spikes without a water level change, an image can verify if it's an overflow or gate operation. A southern city case study showed that points with visual documentation improved anomaly identification efficiency by 60%, reducing the need for manual site visits.
Price Range Analysis: Equipment vs. Total Cost
Equipment prices vary significantly based on operating condition complexity. Below are typical market ranges (RMB):
Basic Tier
12k - 35k RMB
Contact type or simple integration. Suitable for stable pipelines/canals without visual needs.
Mainstream Tier
35k - 85k RMB
Non-contact radar, solar power support. Ideal for sewage networks, outfalls, and open channels.
High-End Tier
85k - 220k+ RMB
Integrated cameras, edge computing, self-cleaning. For critical regulatory nodes.
Note on Total Project Cost: Equipment is only part of the investment. Installation brackets, civil works, cabling, and platform fees can add 10% to over 100% to the base equipment price depending on site difficulty.
Procurement Recommendations: 6 Criteria
Selecting the right device requires a systematic approach beyond price comparison:
Scenario Adaptability
Determine pipe type (full/partial/open), water quality (debris/corrosion), and flow regime. Non-contact for debris/sewage; Contact for stable/low-flow canals.
Parameter Boundaries
Check starting velocity (e.g., <0.05 m/s stability) and water level accuracy. Ensure support for dynamic cross-sectional correction.
Installation Conditions
Assess signal interference (foam/debris), IP rating (IP68 for manholes), and lightning protection for outdoor poles.
Power & Comms
Balance mains power stability vs. solar autonomy. Account for high power consumption if cameras are included.
Calibration Capability
Ensure supplier provides rating curve establishment and periodic re-measurement support.
O&M Response
For batch deployments, spare parts availability and remote diagnostic tools are critical.
Non-Contact Measurement & Cameras: Value vs. Reality
Non-contact measurement reduces sensor corrosion and blockage risks in harsh environments like sewage outfalls. However, it has boundaries: surface velocity may not reflect average velocity, and strong winds or foam can interfere with radar echoes.
Integrated cameras solve the "explainability" problem. In one industrial park project, visual verification helped locate 70% of anomalies (blockages, gate malfunctions) remotely. However, users must manage lens pollution and lighting strategies to maintain high availability.
Maintenance Cost Analysis: The Hidden ROI Factor
ROI analysis must include the Total Cost of Ownership (TCO). While basic units are cheaper upfront, maintenance costs typically run 3-8% of equipment price annually, rising to 8-12% in harsh environments.
Contact Sensors
- Cleanliness: Prone to dirt/fiber adhesion.
- Freq: Every 2 weeks to monthly in sewage.
- Cost: Higher labor due to confined space entry.
Non-Contact / Camera
- Cleanliness: Lens/window cleaning required.
- Freq: Monthly/Quarterly inspections.
- Cost: Lower sensor wear, but higher power/comms costs.
Additionally, calibration (rating) costs should be budgeted every 12-24 months, especially for natural rivers where bed scouring changes the cross-section. Optimizing data strategies (e.g., event-triggered snapshots instead of continuous streaming) can significantly reduce long-term communication and storage costs.
Conclusion: Rational Selection for Smart Water
The Doppler flowmeter market is maturing. Price differentiation is clear: basic units for conventional needs, mainstream non-contact for complex water bodies, and high-end integrated solutions for critical regulatory nodes.
Future trends point towards deeper parameter fusion (velocity + level + imagery + confidence levels) and platform standardization. For project owners, the key to high ROI is not blindly pursuing the highest configuration, but making a comprehensive judgment based on flow velocity ranges, installation environments, and long-term O&M capabilities. As smart water construction advances, these devices will serve as vital nodes in the water system perception network.