In-Depth Comparison of Four Technology Roadmaps for Irrigation District Informatization
Irrigation district informatization is transitioning from an initial stage of "installing equipment and building platforms" to an operational closed-loop stage where systems can measure accurately, control, schedule, and conserve water. Behind keywords such as smart irrigation, water measurement, water-saving evaluation, water-use management, and canal scheduling, no single technology path can solve all problems. Different irrigation districts vary significantly in water source conditions, canal system structure, topography, crop types, management entities, and O&M capabilities.
Technology paths such as radar level sensors, electromagnetic flow meters, ultrasonic flow meters, AI video recognition, LoRa, NB-IoT, 4G/5G, fiber optics, edge computing, digital twins, and smart water distribution algorithms each have their boundaries. This article compares them from the perspectives of technical architecture, sensing and measurement, communication and control, data and algorithms, applicable scenarios, and selection recommendations, providing a reference technical decision framework for irrigation district informatization projects.
I. Technology Path Differences: From Single-Point Automation to System Closed Loop
Early irrigation district informatization often manifested as single-point construction, such as installing video surveillance at canal entrances, replacing gates with electric actuators at management stations, and adding manually recorded water measurement facilities at canal heads. Such construction can improve local conditions but does not necessarily form a closed loop. Truly effective irrigation district informatization typically includes six links: sensing, transmission, decision-making, execution, feedback, and assessment.
- Sensing: Data acquisition for water level, flow rate, rainfall, soil moisture, and gate opening.
- Transmission: Ensuring data reliability, real-time status, and origin verification.
- Decision-making: Water distribution schemes, irrigation timing, water-use indicators, and anomaly identification.
- Execution: Actual actions of gates, valves, pumping stations, and motorized wells.
- Feedback: Recording whether execution results match commands.
- Assessment: Evaluating water-saving effectiveness, water rights usage, equipment health, and management performance.
The choice of technology path is not about the number of devices, but whether a closed loop is formed from data to action and from action to result.
From industry practice, building only video surveillance and electrified gates often merely reduces manual patrol intensity, with limited water-saving effect. Some medium-sized irrigation districts, after completing only gate control and video surveillance, usually see annual water-saving rate improvements not exceeding 5%. When projects further add canal-system water measurement, water distribution models, and water-use ledger management, water-saving rates can improve to 10% to 18%. If pipeline conversion, low-pressure irrigation, smart valves, and soil moisture control are implemented simultaneously, water-saving rates may exceed 20%.
II. Sensing and Water Measurement Technology: Accuracy, Stability, and Applicability
Water measurement is one of the most fundamental and critical links in irrigation district informatization. Without relatively reliable flow and water-level data, smart irrigation, water-saving evaluation, water rights management, and scheduling decision-making are difficult to establish. Common current technologies include open-channel level sensors, open-channel flow meters, pipeline flow meters, pressure-type level sensors, ultrasonic flow meters, electromagnetic flow meters, radar flow meters, and AI video flow measurement.
Radar Level Sensors
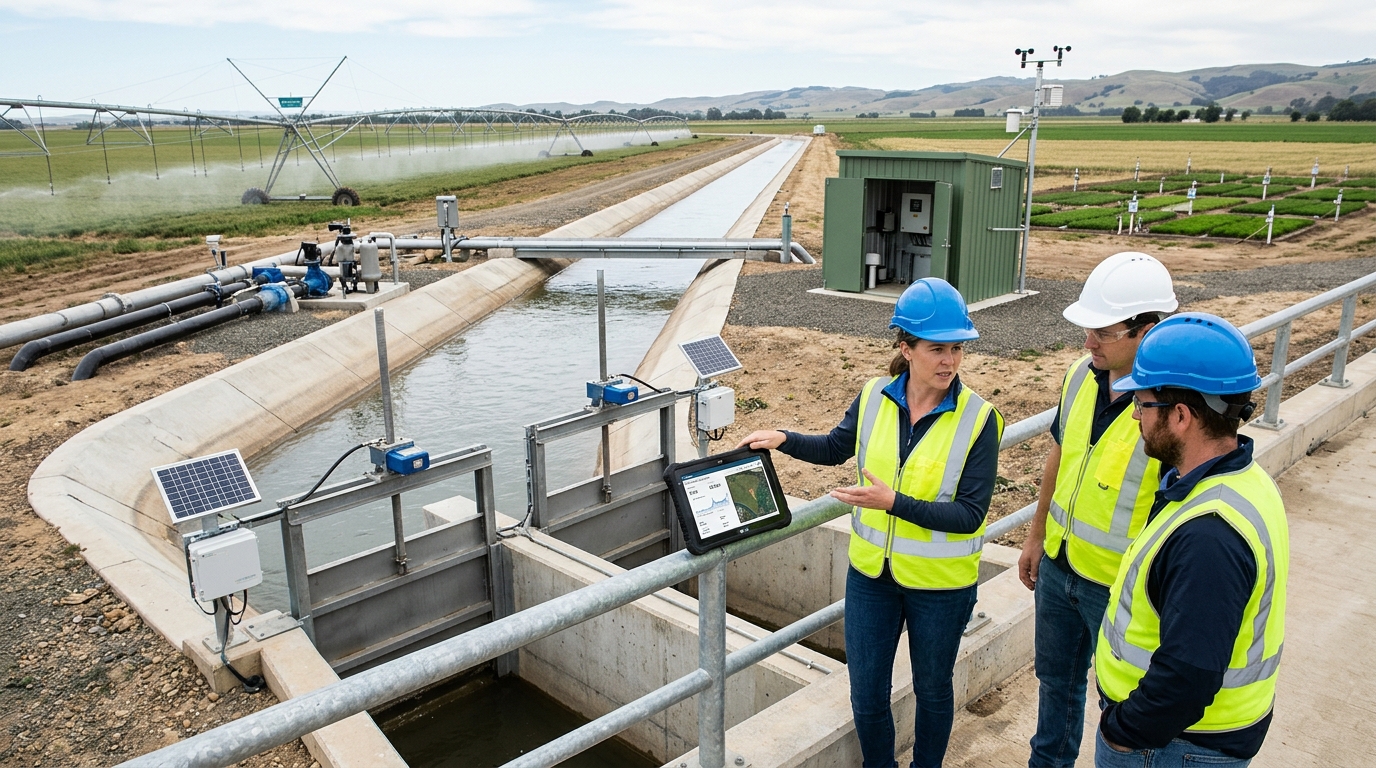
Typically used in open channels and weirs (0-10m range). Accuracy ±1mm to ±3mm. Advantages: Non-contact, simple installation, resistant to sediment. Disadvantages: Sensitive to angle, wind, and floating objects. Requires rain covers and brackets in high-sediment areas.
Open-Channel Radar Flow Meters
Combines radar velocity and level measurement. Accuracy ±3% to ±8%. Suitable for trapezoidal/rectangular channels. Requires regular calibration; channel-bed changes can cause deviation expansion (e.g., ±5% to ±15%) if parameters aren't updated.
Electromagnetic Flow Meters
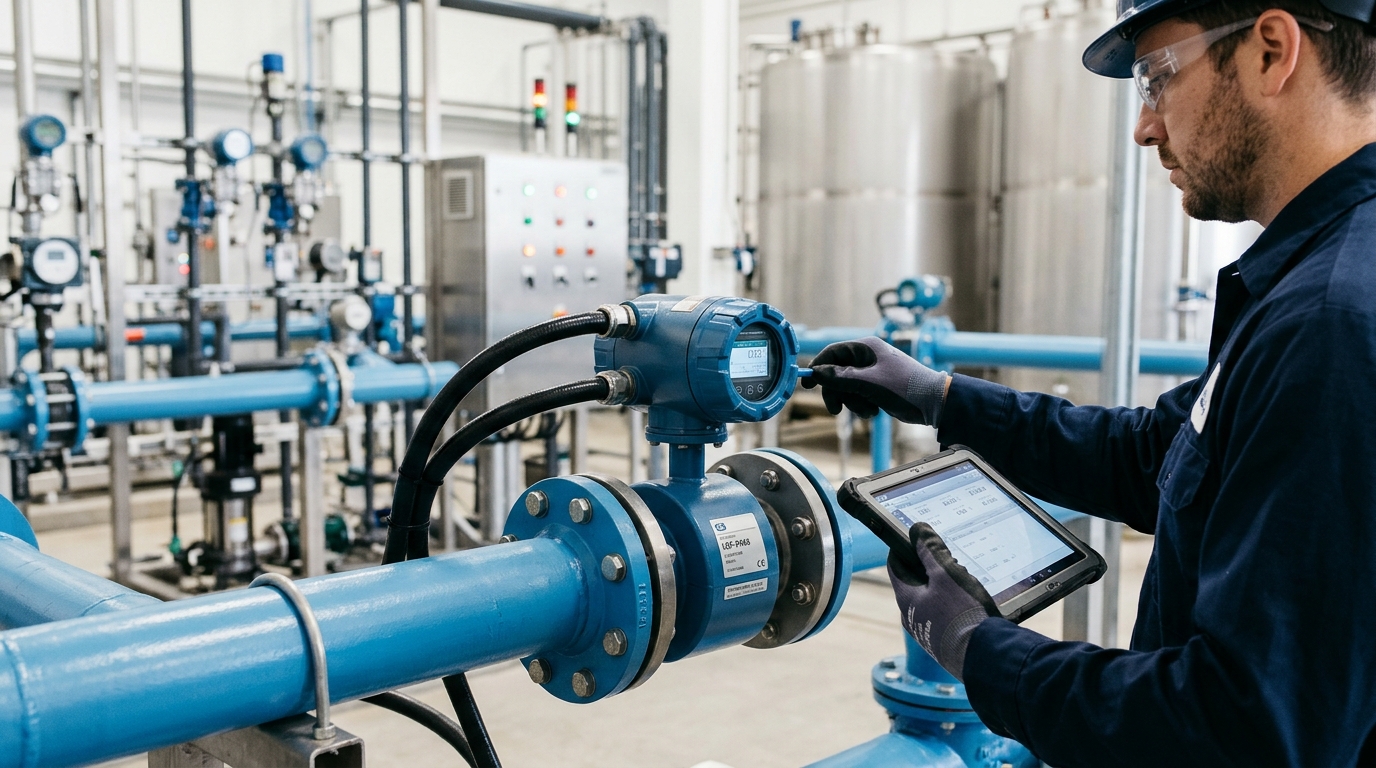
Ideal for pressurized pipelines and well discharge. Accuracy ±0.5% to ±2%. Wide turndown ratio. Not suitable for non-pressure open channels. Sensitive to air bubbles and grounding. Proven to reduce water use by ~30% in northern well districts when combined with pressure control.
Ultrasonic & AI Video Flow Meters
Ultrasonic: ±1% to ±3% accuracy. Easy install but sensitive to surface fluctuations/sediment. AI Video: ±10% to ±20% accuracy. Low cost, good for anomaly detection/patrol, but unsuitable for billing due to lighting/reflection issues.
A more reasonable approach is to use AI video for "anomaly detection, auxiliary verification, and event logging," and to use radar, electromagnetic, or ultrasonic devices for "continuous metering, scheduling control, and performance assessment."
III. Communication and Terminal Control: LoRa, NB-IoT, 4G/5G, Fiber Optics, and Edge Control
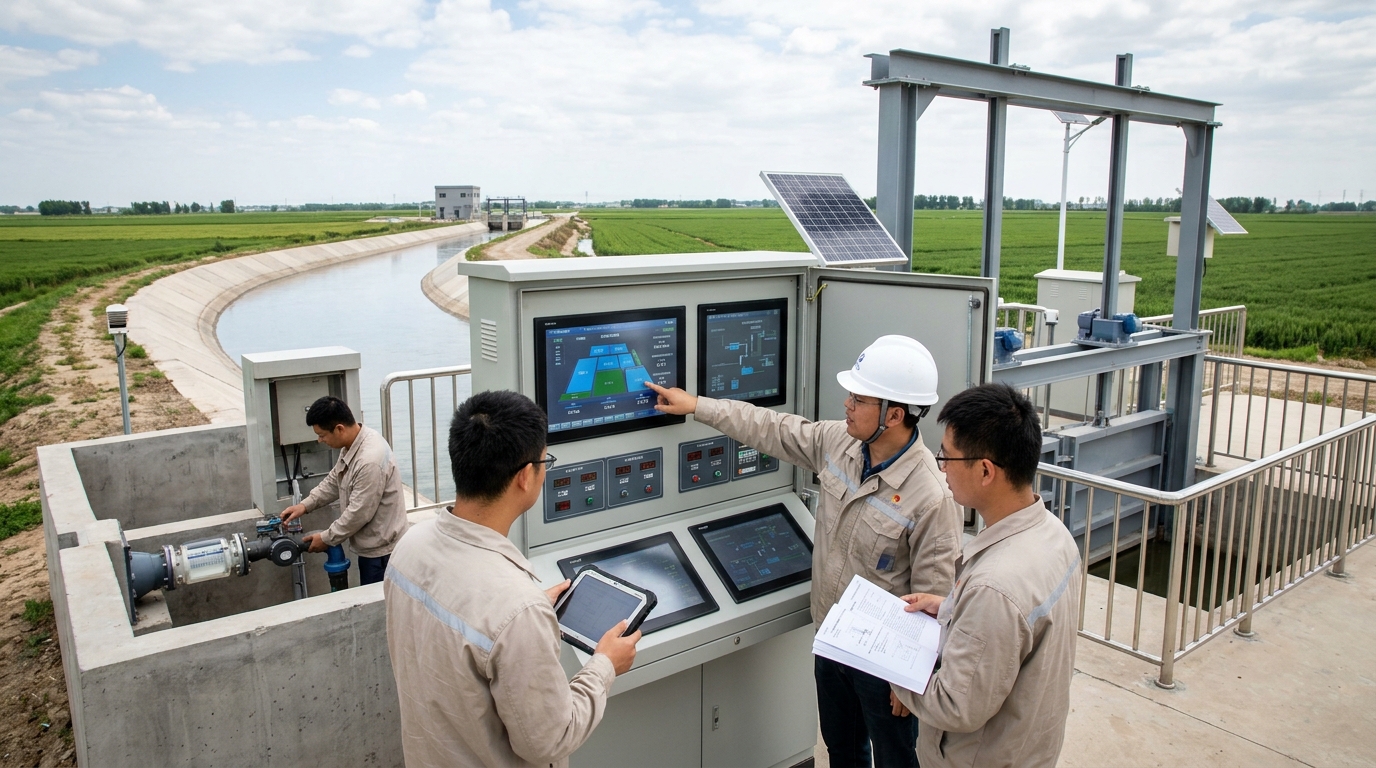
The selection of irrigation district communication networks depends on monitoring point distribution, data frequency, video requirements, power conditions, and O&M capabilities. They are not simple substitutes but layered combinations. Management stations and large gate stations usually suit fiber optics or 4G/5G; dispersed channel points suit low-power wireless; remote mountainous areas may consider LoRa networking or BeiDou short messages.
| Technology | Best Application | Key Pros/Cons |
|---|---|---|
| LoRa | Dispersed low-power sensors (water level, flow) | Pros: Low cost, long battery life. Cons: Needs gateways, obstruction risk in mountains. |
| NB-IoT | Public network coverage areas | Pros: No self-built gateway. Cons: Blind zones in underground/remote sites. |
| 4G/5G | Video surveillance, high-frequency data | Pros: High bandwidth, low latency (5G). Cons: Higher cost, not economical for sparse points. |
| Fiber Optics | Backbone network (stations, centers) | Pros: Stable, anti-interference. Cons: High construction cost, long deployment time. |
For terminal control, it is recommended to adopt a structure of "cloud decision-making, edge execution, and local safety interlock." The cloud handles model calculation, edge gateways issue commands, and local PLCs/RTUs handle execution and fault protection. Relying entirely on the cloud poses risks during network interruptions, potentially leading to canal overflow or equipment damage.
IV. Data Platforms and Algorithms: Digital Twins, Water Distribution, and Evaluation
After entering the data platform stage, differences lie in storage, model computation, and business linkage. Traditional SCADA excels at real-time alarms but lacks optimization. Cloud platforms support multi-site access but require attention to data sovereignty. Digital twins map physical assets into models but must avoid becoming mere "visualization dashboards" without hydraulic logic.
Water Distribution Scheduling Algorithms
Require cross-section parameters, gate characteristics, roughness, and crop quotas. If model error exceeds 15%, direct automatic execution is not advisable. In large districts, platforms can reduce scheme generation time from 3 hours to 30 minutes, but manual review remains crucial for anomalies like heavy rain or sensor faults.
Smart Irrigation & Water-Saving Evaluation
Field-scale algorithms use soil moisture, weather, and crop stages. Threshold control is reliable for small farms; predictive control avoids pre-rain waste. Mature evaluation systems create an "inflow—supply—use—return flow—loss" balance table, generating diagnostic reports to support decision-making rather than just displaying raw data.
V. Applicable Scenarios: Matching Technology to District Type
VI. Selection Recommendations: Requirements, Investment, O&M, Security
The first step is clarifying core objectives. Are you solving for metering/billing, reducing patrol, improving utilization coefficients, or supporting water rights trading? Different goals dictate different tech stacks.
- Investment Assessment: Equipment is only 40-60% of total cost. Budget 5-10% annually for maintenance. Lack of O&M leads to data drift and platform credibility loss within 2-3 years.
- O&M Capability: Large districts can handle complex models; small townships need low-maintenance, easy-calibration devices with remote diagnostics. Solar power and theft prevention are critical for rural sites.
- Security & Permissions: Implement hierarchical permissions, operation logs, and encryption. Classify control commands (query, suggest, remote, auto) with strict safety thresholds for automatic execution.
- Integration: Ensure support for Modbus, MQTT, HTTP, OPC UA. Define data standards (point codes, units, timestamps) upfront to prevent silos. Specify interface documentation and export permissions in contracts.
VII. Concluding Outlook
Future irrigation district informatization will move beyond "more sensors and flashier 3D" toward standardization, modeling, resilience, and incentives. Standardization ensures compatibility; modeling relies on robust hydraulics and crop science rather than just experience; resilience guarantees safety control during extreme events; and credible data enables water-saving benefits and rights trading.
Overall, the optimal path for irrigation district informatization is not the most complex path, but the path that matches water source conditions, canal system structure, management capability, and funding level and can operate stably over the long term.