Development Opportunities for Low-Carbon Industrial Parks in 2026 Under the Carbon Peaking and Carbon Neutrality Goals
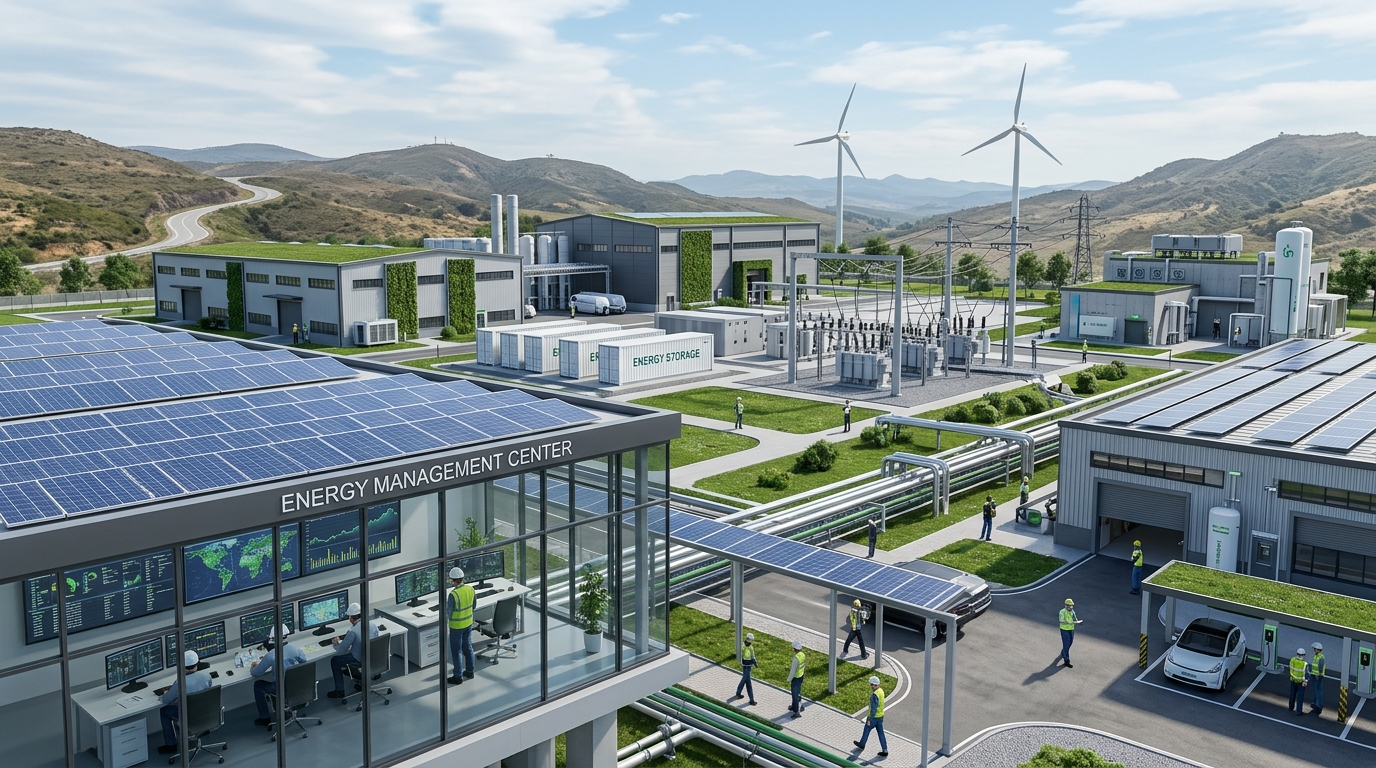
Low-carbon parks are moving from policy pilots to industrial imperatives. As the “dual carbon” goals enter implementation, parks are no longer merely spaces bearing energy consumption and carbon emissions, but key units for coordinated implementation of energy transition, energy efficiency optimization, carbon asset management, and green manufacturing. EMS (Energy Management System), as the hub of park-level energy operations, is deeply integrating with capabilities such as distributed PV, energy storage, demand response, carbon accounting, and virtual power plants. Industry observers believe that the future competitive focus of low-carbon parks will shift from “whether to save energy” to “whether they can form a quantifiable and replicable operating model that balances safety, cost, carbon constraints, and returns.”
I. Market Trends: Low-Carbon Parks Move from “Demonstration Projects” to “Large-Scale Deployment”
Based on public research and industry statistical definitions, industrial parks and development zones contribute about 60% of national industrial energy consumption and about 30% of national carbon emissions. National-level economic development zones, high-tech zones, and other industrial clusters contribute about one-quarter of national GDP on a relatively small land area, and concentrate large loads of high energy consumption, high electricity use, high heat demand, and logistics warehousing. This structure means that low-carbon parks are not a peripheral issue but the main battlefield for industrial energy conservation and carbon reduction.
In the past, low-carbon park development relied more on individual enterprise retrofits, such as boiler energy-saving, motor variable-frequency drives, lighting replacement, and rooftop PV. As policy transitions from “dual control of energy consumption and intensity” to “dual control of carbon emissions and intensity,” park-level energy systems, carbon ledgers, green electricity absorption, and supply-chain carbon footprints are beginning to be reviewed in an integrated manner. Project forms in the market are also shifting from “single-point energy saving” to “park-level integrated energy services,” that is, forming holistic solutions through EMS, energy efficiency optimization, source-grid-load-storage coordination, and carbon management.
On the capital side, green credit, energy performance contracting, green bonds, and infrastructure REITs provide more financing channels for park retrofits. Owners’ concerns have become more pragmatic: payback period, reduction in energy costs, carbon compliance costs, green electricity share, load safety, and whether production continuity is affected. Low-carbon parks are transitioning from “policy showcase projects” to “operating cost and asset value projects.”
II. Policy Impacts: From Dual Control of Energy Consumption to Dual Control of Carbon Emissions, Expanding Park Responsibility Boundaries
The impact of the “dual carbon” policy on parks is shifting from directional requirements to assessable indicators. Since 2023, carbon emission statistical accounting, carbon emission management in key industries, and local pilots for dual control of carbon emissions have continued to advance. After the national carbon market was expanded to cover the power sector, expectations for expansion to key industries such as steel, cement, and electrolytic aluminum have increased. Once enterprises in a park fall within the scope of emissions control or carbon footprint disclosure, energy management is no longer merely electricity cost optimization but directly affects carbon allowances, carbon costs, and product export competitiveness.
Carbon Price Signals: Taking the national carbon market as an example, recent average allowance transaction prices have repeatedly operated around approximately RMB 100 per ton. For a park enterprise with annual carbon emissions of 100,000 tons, each RMB 10/ton increase in carbon price results in a potential cost change at the million-yuan level. If combined with green electricity premiums, carbon allowance shortfalls, and supply-chain disclosure requirements, the economics of low-carbon retrofits are no longer determined solely by electricity cost savings but are jointly determined by “electricity cost + carbon cost + financing cost + brand value.”
Green electricity policies are equally important. Renewable energy consumption responsibility weights, green certificate trading, and green electricity trading are expanding parks’ operational space. Export-oriented parks are particularly affected by the EU Carbon Border Adjustment Mechanism, customer requirements for product carbon footprint disclosure, and supply-chain Scope 2 emissions. Low-carbon parks need to integrate PV, wind power, energy storage, green certificate procurement, and carbon accounting; otherwise, relying solely on local energy saving will make it difficult to meet future regulatory and customer audits.
III. EMS: Park Energy Management Moves from “Visible” to “Optimizable”
EMS is the digital foundation of low-carbon parks. Traditional park energy management often remains at meter reading, dashboard viewing, and post-event statistics, making it difficult to support real-time optimization. Mature park-level EMS typically has data ingestion capabilities for electricity, heat, cooling, gas, water, steam, compressed air, PV output, energy storage status, and carbon emissions. In typical industry projects, smart meter accuracy often uses class 0.5S or 1.0, sampling periods at key nodes are 1 to 5 seconds, and data collection completeness is generally required to reach 98% or higher.
The value of EMS goes beyond dashboards. Through load forecasting, anomaly detection, equipment energy efficiency diagnostics, demand management, and optimized dispatch, it converts energy data into operational actions. Typical forecasting metrics include: daily load forecast error controlled within 5%, real-time load forecast error controlled within 10%, and response time for abnormal energy use detection under 1 minute. For parks with multiple factory buildings, data centers, commercial facilities, and charging stations, EMS can identify hidden waste such as nighttime base load, compressed air leaks, inefficient HVAC operation, and uneven transformer loading.
More importantly, EMS is upgrading from energy management to an “integrated energy and carbon” platform. It can automatically convert Scope 1 and Scope 2 emissions, allocate carbon footprints by enterprise, building, process, equipment, and product, and provide a data foundation for carbon reporting, proof of green electricity consumption, and supply-chain disclosure. The key to future park competition is not who installs more sensors, but who can turn data into executable energy-saving strategies, verifiable carbon outcomes, and tradable energy assets.
IV. Energy Efficiency Optimization and Energy Saving: Technology Mix Determines the Upper Limit of Park Decarbonization
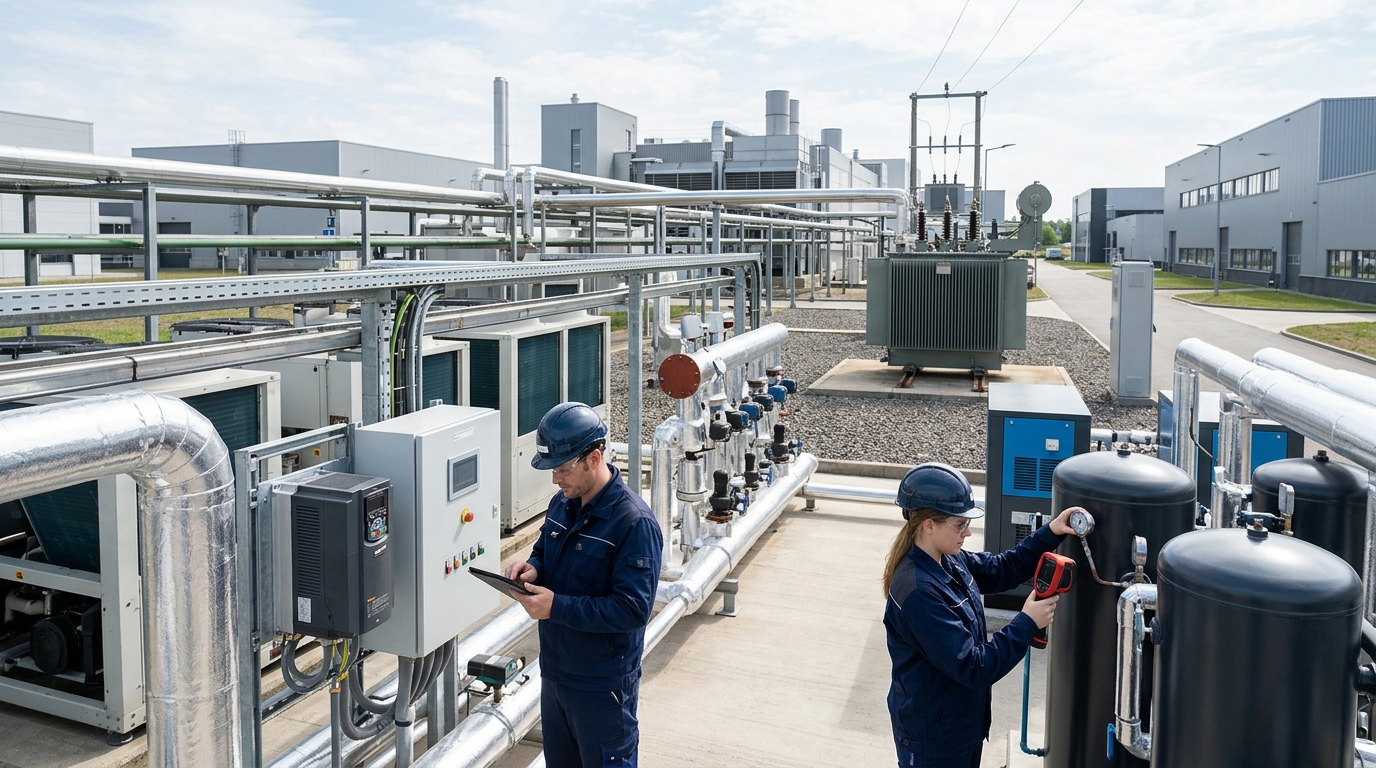
The technology roadmap for low-carbon parks is not solely PV or energy storage, but a combination of “electrification + energy saving + waste heat recovery + system optimization.” In industrial scenarios, motor systems, compressed air, chiller plants, steam systems, and process heating are usually high-energy-consumption segments. High-efficiency motors and variable-frequency drive retrofits can save 10% to 30% of energy in some fan and pump systems; compressed air systems commonly achieve 10% to 20% energy savings through pipeline leak detection, pressure optimization, and variable-frequency control; chiller plants can achieve 15% to 25% energy savings after group-control optimization and improved cooling source matching.
Waste Heat Recovery
Chemical, building materials, food, textile, and data centers all have medium- and low-temperature waste heat. Heat pumps can raise the temperature of waste heat for use in heating, domestic hot water, or process preheating, with typical COPs of 3 to 5. If the waste heat resource is stable, the system payback period is often better than simple equipment replacement. Data centers reduce PUE through liquid cooling, natural cooling sources, airflow management, and load forecasting; PUE targets for new projects are often advancing from around 1.5 to 1.3 or even below 1.25.
Source-Side Technologies
Distributed PV module efficiencies have generally entered the 20% to 23% range; park rooftops, carports, and idle land can form stable sources of green electricity. Commercial and industrial energy storage is mostly configured for 2 to 4 hours of duration, and lithium iron phosphate systems can achieve cycle lives of more than 6,000 cycles. PV addresses partial energy substitution, energy storage addresses load shifting and demand management, and EMS addresses dispatch optimization. When the three are combined, common improvements in park comprehensive energy efficiency range from 8% to 20%.
V. Source-Grid-Load-Storage and Virtual Power Plants: Parks Shift from Energy Consumers to Prosumers
The next phase of low-carbon parks is not passive electricity consumption, but becoming adjustable nodes in a distributed energy network. HVAC, lighting, charging piles, energy storage, process buffer loads, and some interruptible equipment within parks can be aggregated by EMS into adjustable resources. Typical parks can have adjustable load ratios of 5% to 20% of total load, with response times ranging from seconds to minutes. After participating in demand response, parks can obtain peak-shaving subsidies, capacity compensation, or electricity cost optimization benefits.
Peak-valley price spreads are the basis for park energy storage and load dispatch revenues. In many provinces, the peak-valley price spread for commercial and industrial electricity has reached 0.6 to 1.2 RMB/kWh. If an 8 MWh energy storage system completes two charge-discharge cycles per day, with an effective price spread of 0.7 RMB/kWh, the annual arbitrage potential can reach several million RMB. Actual revenues are affected by charge-discharge strategies, battery degradation, O&M costs, and safety constraints, but the value of EMS lies in turning static equipment into dynamic revenue-generating assets.
Virtual power plants extend the energy value of parks. A single park has limited resources, but multiple parks can participate in electricity markets, ancillary services, and demand response through aggregation platforms. Future parks will no longer be merely “electricity consumption units” but may become complex entities of “microgrid + virtual power plant + carbon asset platform.” For park operators, this means that the revenue structure expands from property management, electricity price differentials, and energy-saving services to energy dispatch revenues, green electricity revenues, and carbon asset revenues.
VI. Carbon Assets, Green Electricity, and ESG: The Second Growth Curve of Low-Carbon Parks
The commercial value of low-carbon parks is expanding from “saving electricity costs” to “carbon assets.” Based on China’s average grid emission factor of approximately 0.57 to 0.58 kg CO2/kWh, if a 12 MW distributed PV project generates about 15 million kWh per year, the corresponding carbon reduction is approximately 8,500 to 8,700 tons. If the park simultaneously reduces annual electricity consumption by 10 million kWh through energy-saving retrofits, it can further reduce Scope 2 emissions by approximately 570 to 580 tons. Such data were previously difficult to aggregate accurately, but EMS and carbon accounting platforms make them traceable, disclosable, and tradable.
Proof of green electricity consumption is becoming increasingly important for enterprises in parks. Multinational customers and exporting enterprises often require suppliers to disclose Scope 2 emissions and prove renewable energy usage. Green certificates, green electricity trading contracts, PV self-generation self-consumption data, and energy storage absorption data can form a combined evidence chain. If a park can provide a unified carbon ledger, green electricity proof, and energy efficiency diagnostics, it will enhance its attractiveness to high-quality manufacturing enterprises and data centers.
ESG is not just a report but a financing and customer screening tool. Green finance places greater emphasis on verifiable emission reductions, energy efficiency, and carbon management capabilities. If a park can establish auditable energy consumption data, carbon footprint data, and energy-saving project revenue models, it is more likely to obtain low-cost funding. Low-carbon parks thus form a positive cycle: credible data leads to financing convenience, financing convenience drives technology upgrades, and technology upgrades further reduce energy and carbon costs.
VII. Typical Cases and Economic Boundaries: How to Calculate Investment Payback
Taking a typical comprehensive park in East China as an example: annual electricity consumption is about 120 million kWh, average electricity price is about 0.75 RMB/kWh, park rooftops can accommodate 12 MW of distributed PV, supported by 4 MW/8 MWh of energy storage, and deployed with park-level EMS and energy-carbon platform. A rough estimate shows PV investment of about RMB 48 million, energy storage investment of about RMB 12 million, EMS and carbon management platform of about RMB 5 million, distribution, communications, and local energy-saving retrofits of about RMB 10 million, with total investment of about RMB 75 million.
Revenue Breakdown Estimate
- PV Revenue: Annual generation ~15 million kWh. With 80% self-consumed and 20% fed to grid, annual revenue ~RMB 10 million.
- Energy Storage Arbitrage: Two cycles/day with 0.7 RMB/kWh spread yields ~RMB 3.5–5 million annually.
- EMS Efficiency Savings: 8% comprehensive energy saving on 120M kWh base saves ~RMB 7.2 million annually.
- Total Annual Revenue: Combined with demand response, total reaches ~RMB 20–23 million.
Based on this, the static payback period is approximately 4 to 6 years, and the project internal rate of return can fall in the 7% to 12% range. This calculation shows that low-carbon parks are not only about policy costs but can also form stable cash flows. However, risks also exist: changes in electricity tariff structures, decreases in PV utilization hours, energy storage cycle-life degradation, equipment failures, park load fluctuations, and adjustments to carbon market rules can all change the revenue model. Mature projects require upfront load diagnostics, data governance, and investment sensitivity analysis.
VIII. Outlook and Conclusion: In the Next Three to Five Years, Parks Will Enter the “Energy-Carbon-Data” Synergy Stage
In the next three to five years, low-carbon parks will move from “equipment stacking” to “system synergy.” AI load forecasting, digital twins, equipment health diagnostics, carbon footprint tracking, and virtual power plant aggregation will become standard. Park EMS will no longer be merely an energy dashboard but will evolve into an “energy-carbon-asset” operating platform. Data interfaces among enterprises, parks, and the grid will become more standardized, and direct green electricity connections, park microgrids, shared energy storage, and cross-park demand response will also gradually mature.
At the technical level, energy efficiency optimization will continue to advance toward the system level. Energy-saving potential for single pieces of equipment is gradually converging, while coupled optimization of processes, buildings, energy, production scheduling, and carbon management will become new sources. Parks will use finer-granularity energy consumption metering to identify ineffective loads, inefficient equipment, and unreasonable operating strategies. Truly leading parks in the future will not be those with the most energy facilities, but those with the lowest energy consumption per unit output, carbon emissions per unit output, and energy costs, while also being verifiable.
Conclusion: The core of low-carbon parks is not slogans but engineering, data, and operations. The dual carbon goals are driving parks from extensive energy use to refined governance; EMS provides sensing and optimization capabilities; energy efficiency optimization and energy-saving retrofits determine the room for cost reduction; green electricity, energy storage, carbon assets, and virtual power plants expand the revenue boundary. For park operators, the key to the next phase lies in establishing a quantifiable, auditable, and sustainable energy-carbon management system. For the industry, low-carbon parks will become an important testing ground for China’s industrial green transition shifting from policy-driven to market-driven development.