RTU Telemetry Terminal Routine Maintenance and Troubleshooting Manual
A comprehensive guide for field installation, configuration, commissioning, and maintenance of water resources telemetry terminals.
Introduction: From Field Installation to Stable Operation
In water resources monitoring, flood control, dispatching, and irrigation district metering, RTU (Remote Terminal Unit) telemetry terminals are responsible for critical tasks including field data acquisition, edge caching, remote transmission, and alarm linkage. Unlike laboratory equipment, water resources field sites commonly face challenges such as power supply fluctuations, unstable signals, lightning interference, sediment blockage, and inconvenient manual maintenance.
Whether a monitoring station can operate stably over the long term depends not on the parameters of a single device, but on whether installation, configuration, commissioning, and maintenance form a closed loop. Drawing on Yicai Technology's field experience in water resources monitoring projects, this manual focuses on replicable, inspectable, and traceable operating methods.
Note: This article uses the Hero V9 telemetry terminal as an example. Most values provided are engineering experience values; actual deployment should be adjusted according to the specific device manual, site conditions, and platform protocol.
I. Pre-installation Preparation and Installation Steps
1. Environmental Assessment & Equipment List
Before installation, complete an environmental assessment. The field team must determine the location type (river floodplain, reservoir dam abutment, or irrigation headworks), power availability (mains vs. solar), and signal stability (4G/5G/NB-IoT).
- Signal Test: Recommended 1 week in advance. If RSRP is persistently below -105 dBm, prepare an external high-gain antenna or adjust the site.
- Equipment Checklist: RTU main unit, communication module, antenna, solar panel, battery, sensors (water level, rainfall, flow), surge arrester, grounding cable, waterproof connectors, fuses, and labels.
- Parameter Confirmation: Verify Hero V9 power supply range, serial ports (RS485/RS232), analog channels, IP rating, and sensor measurement ranges/elevations.
2. Physical Installation Guidelines
Adhere to strict physical installation standards to ensure longevity and safety.
Mounting Height & Protection
Enclosure bottom ≥ 1.2 m above ground (raise to 1.5–2.0 m in flood-prone areas). Outdoor cabinets require IP54 minimum; IP65 recommended for critical stations. Cable entry holes must face downward and be waterproofed.
Wiring Principles
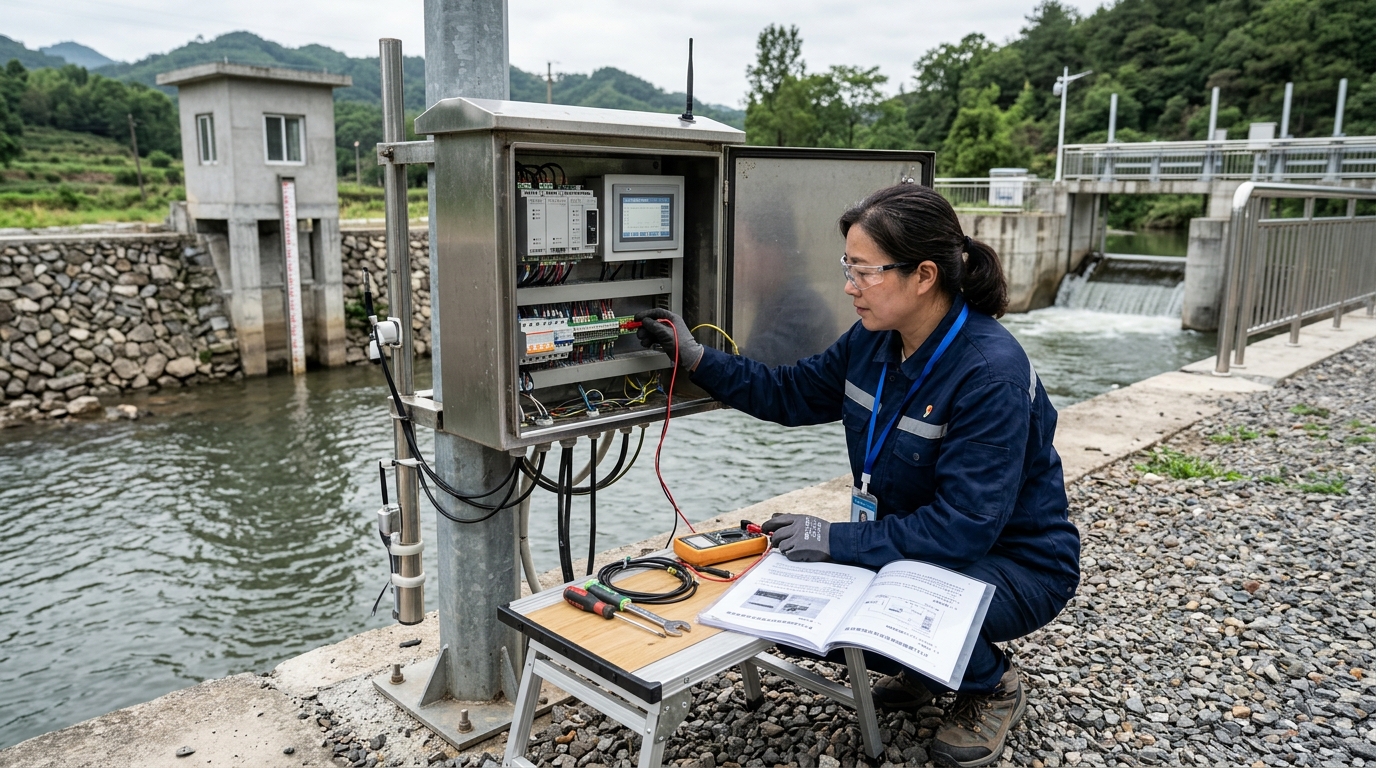
De-energize first, wire second, energize third. Use shielded twisted-pair for RS485 (consistent A/B polarity, one-end shield grounding). Add fuses on the power side and label both ends of cables.
3. Solar Power Configuration Example
Estimate battery capacity based on average daily power consumption, consecutive cloudy/rainy days, and a safety factor.
Case Study: Station with 0.8 W avg consumption, 5 cloudy days, safety factor 1.5 requires ~144 Wh. Considering losses, select a 12V/20Ah to 12V/30Ah battery and a 10W to 20W solar panel.
After wiring, perform insulation, continuity, and short-circuit checks before energizing. Ensure the antenna is external and above metal obstructions.
Field Tip: At a river station, moving the antenna to a 2.5 m pole improved RSRP from -108 dBm to -93 dBm, increasing three-day data completeness from 92% to 99.6%.
II. Data Acquisition Configuration
1. Sensor Integration & Communication
Ensure the RTU correctly reads sensors by standardizing communication parameters.
- RS485 Bus: Unified baud rate, data bits, stop bits, and parity (e.g., 9600,8,N,1). Device addresses must be unique (e.g., Water Level: 01, Rainfall: 02, Flow: 03).
- Analog Devices: Confirm 2-wire vs. 4-wire power supply for 4-20 mA devices to avoid low readings due to insufficient RTU power.
2. Sampling Frequency Optimization
Balance real-time performance with power consumption. Remote reporting frequency does not need to match acquisition frequency.
| Sensor Type | Recommended Acquisition Interval | Reporting Strategy |
|---|---|---|
| Water Level | 1 min – 5 min | Every 30–60 min |
| Rainfall | Accumulate over 5–10 min | On change or periodic |
| Flow Rate | 1 min – 5 min | Every 30–60 min |
| Water Quality | 10 min – 30 min | Periodic |
3. Range Calibration & Caching
Calibration determines data credibility. Include calibration records in acceptance documentation (date, environment, original readings, correction values).
- Pressure Water Level: Measure installation elevation; error target ±1 cm. Account for temperature compensation (~10 kPa per 1 m water column).
- Tipping-Bucket Rain Gauge: Check levelness and unobstruction. Compare pulse counts via graduated cylinder water pouring.
- Electromagnetic/Ultrasonic Flow Meters: Verify pipe diameter, velocity range, full-pipe condition, and installation direction.
- Local Caching: Enable backfill transmission after network disconnection. Cache duration should be ≥ 30 days.
Warning: At an irrigation station, a thunderstorm caused module restarts. Because backfill was not enabled, 4 hours of data were lost. After adjustment, historical data could be backfilled within 30 minutes of recovery.
III. Remote Transmission Commissioning
1. Communication Mode Selection
4G Cat1/Cat4
Best for multiple parameters and relatively high real-time requirements.
NB-IoT
Ideal for battery-powered, low-frequency, small-data scenarios.
5G
For video or high-bandwidth needs; evaluate coverage and power consumption.
2. Protocol & Platform Integration
Common access methods include MQTT, HTTP, TCP transparent transmission, and carrier platforms.
- SIM Card: Confirm carrier, APN, activation status, and tariff validity. "Online but no data" is often due to inactive cards or incorrect APNs.
- MQTT: Configure broker address, port (1883 normal / 8883 TLS), topic, credentials, and QoS.
- Data Format: JSON is recommended. Fields must include device code, timestamp, sensor values, voltage, and signal strength.
- Heartbeat & Reconnection: Set heartbeat to 60–300 s and reconnection interval to 10–30 s with random backoff to prevent congestion.
3. Minimum Link Verification Workflow
- Confirm module registers on the network and read signal strength.
- Confirm device connects to the platform (check DNS, ports, certificates).
- Verify platform receives raw messages.
- Reconcile real-time data, historical data, and alarm data.
Troubleshooting Case: Nighttime data gaps at a reservoir station were traced to 4G module restarts every 2 hours. Cause: Undersized power cable gauge caused voltage drop during transmission bursts. Solution: Replace cable with larger gauge and add fuses. Result: 99.8% data completeness over 72 hours.
IV. Field Commissioning, Acceptance, and Routine Maintenance
1. Quantitative Acceptance Criteria
Do not rely solely on platform display. Establish quantitative metrics for 72-hour continuous observation:
2. Data Comparison Methods
- Water Level: Compare with staff gauge (Error target: ±2 cm).
- Rainfall: Compare with manual rain gauge or graduated cylinder (Error target: ±0.2 mm).
- Flow: Compare with portable current meter or manufacturer calibration data.
3. Routine Maintenance Schedule
| Frequency | Action Items |
|---|---|
| Monthly | Remote inspection of online rate, voltage, signal strength, and logs. |
| Quarterly | Field cleaning of solar panels, rain gauges, antennas. Inspect seals, cables, and grounding. |
| Pre-Thunderstorm | Special inspection of surge arresters and grounding resistance (Target: ≤ 4 Ω). |
For 12V lead-acid batteries, float charging voltage should be 13.5–13.8 V. Investigate if persistently < 11.8 V or > 14.4 V. Always back up configurations before firmware upgrades.
V. Common Fault Troubleshooting Guide
1. No Data / Offline Issues
Follow the order: Power Supply → Communication → Acquisition → Platform.
- Device Online, No App Data: Check serial port timeouts, Modbus addresses, and sensor power supply.
- Device Completely Offline: Read module status. Check antenna connectors, feeder cables, and APN settings.
- Voltage Fluctuations: Measure solar open-circuit voltage, controller output, and battery/load terminal voltages. Look for drops during transmission bursts.
2. Data Anomalies (Jumps/Deviations)
- Water Level Sudden Change: Likely water ingress or poor grounding.
- Low Rainfall Readings: Funnel blockage or stuck tipping bucket.
- Flow Meter Anomalies: Air bubbles, sediment, partial pipe conditions, or incorrect installation direction.
- General Checks: Compare with manual observations. Check for sensor fouling, zero point drift, loose wiring, and electromagnetic interference.
3. Communication Conflicts & Duplicate Data
RS485 conflicts and duplicate platform entries are common. Causes include duplicate bus addresses, inconsistent baud rates, missing termination resistors, or grounding shields at both ends.
Resolution: Assign unique codes to each station. Add deduplication checks on the platform. Retain acquisition time and upload time in backfilled data.
Case: Duplicate water level entries were caused by old and new devices sharing the same station_id. Changing the code and cleaning mappings resolved the issue.
VI. Outlook: Standardization & Edge Intelligence
As water resources informatization shifts from "data existence" to "data trustworthiness," the role of RTUs is evolving. Future stations must perform data quality assessment, anomaly identification, and interlocking control at the edge.
The engineering value of devices like the Hero V9 lies in stable access, standardized configuration, and maintainability. Unified coding, traceable logs, remote O&M, and predictive maintenance are becoming basic requirements.
When field personnel can complete installation, commissioning, maintenance, and fault troubleshooting according to a unified process, the water resources monitoring network truly upgrades from single-point devices to an operable, scalable, and auditable data infrastructure.